A disease model is a weather-driven biological algorithm that estimates the risk of infection by a specific pathogen – based on temperature, air humidity, leaf wetness duration, and crop growth stage – before any symptoms become visible to the naked eye.
In brief
In June, the greatest pressure comes from fungal and bacterial diseases: potato late blight, powdery mildews, rusts, septoria, fusarium head blight, grey mould, white mould, and cercospora leaf spot in beet. Disease models and agricultural weather stations make it possible to anticipate the moment of infection and apply treatments when genuinely warranted, rather than on a rigid calendar schedule.
- Infection risk increases at 15–25°C, with prolonged dew and several consecutive days of wet weather.
- A disease model warns before symptoms appear, allowing time for a protective treatment.
- Decisions should be based on field-specific data, not on averaged regional thresholds found online.
- A weather station, insect traps, and regular field scouting form the minimum dataset required.
- FarmPortal combines this data with a treatment log, keeping the decision and its documentation in one place.

What are disease models and why is June critical?
Disease models are tools that convert weather conditions into a risk score for a specific disease and indicate when a pathogen has optimal conditions to infect a plant. They operate within Decision Support Systems (DSS). Rather than asking "has a week passed since the last spray?", they ask "have infection conditions occurred in recent days?"
June combines three things at once. Crops have reached their full canopy, temperatures favour fungal development, and rainfall and dew keep leaves moist for many hours. This is the window in which a single outbreak can sweep across an entire field within days, if the grower reacts too slowly or ignores a forecast.
The Institute of Plant Protection – National Research Institute (IOR-PIB) runs the Pest and Disease Alert Platform, which publishes monitoring methodologies and threat bulletins covering, among others, fusarium head blight, powdery mildew in cereals, fusarium in maize, and cercospora leaf spot in beet. This reflects a straightforward principle: pest and disease pressure shifts with the weather, so monitoring must be continuous rather than seasonal.
This is the central argument of this article. Calendar-based crop protection is both costly and imprecise: some treatments are applied without genuine risk, others too late. Disease models grounded in field-specific data shift decision-making from routine to evidence.
Which diseases most commonly affect crops in June?
In June, fungal and bacterial diseases of leaves, ears, and shoots dominate, with their severity determined by the crop and local weather. Cereals, potatoes, oilseed rape, sugar beet, strawberries, and field vegetables demand the most attention. The table below lists the diseases to prioritise.
| Crop | Key diseases in June |
|---|---|
| Wheat, barley, rye, triticale | powdery mildew of cereals and grasses, septoria leaf blotch, rusts, brown leaf spot, fusarium head blight |
| Winter oilseed rape | white mould (Sclerotinia), alternaria blight, grey mould, phoma stem canker; risk increases in humid conditions and with a dense canopy |
| Potato | late blight, early blight (Alternaria), Rhizoctonia, anthracnose; from June onwards, late blight and early blight are the primary concerns |
| Sugar beet | cercospora leaf spot, powdery mildew, beet rust, leaf spot complexes; cercospora typically becomes significant from late June and into July |
| Maize | stalk rots, fusarium diseases, common smut; symptoms often appear later in the season, but infections may begin earlier |
| Strawberry | grey mould, powdery mildew, white and red leaf spot, anthracnose, verticillium wilt, angular leaf spot (bacterial) |
| Field vegetables | tomato late blight, alternaria blight, powdery mildews, grey mould, bacterial diseases, root and crown rots |
| Orchards and berry crops | apple scab, apple powdery mildew, grey mould, brown rot of stone fruits, leaf spot diseases, anthracnoses |
Source: FarmPortal, based on integrated pest management methodologies and IOR-PIB pest alert bulletins, as at June 2026.
In practice, I typically scan for several things at once: fusarium head blight in cereals, powdery mildew and rusts, late blight and early blight in potatoes, grey mould in strawberries and vegetables, white mould in oilseed rape, and cercospora leaf spot in beet. These are the pathogens that can spread with remarkable speed when conditions are right.
There is one trap worth remembering. Many diseases only become visible once infection is already under way. Field scouting alone, without weather forecasts and a risk model, frequently gives too little warning.
What weather conditions trigger infection?
Most fungal diseases require moisture on leaves and moderate temperatures, which makes runs of several wet days at around 15–25°C – with prolonged dew – the most dangerous conditions. A dense canopy, poor airflow, and previous infections on the same field all increase the risk further.
The key warning signs are straightforward. Several days of wet weather. Persistent dew. Temperatures in the pathogen's preferred range. Under such conditions, it is worth scouting more frequently – every few days – because disease can spread from isolated patches to the whole field before a weekly inspection would catch it.
| Disease | Temperature | Humidity / leaf wetness | Trigger for action |
|---|---|---|---|
| Late blight (potato) | 15–22°C | high humidity, prolonged leaf wetness | several consecutive "critical periods" |
| Powdery mildew (cereals) | 15–22°C | high humidity, dense canopy | first mycelium patches on leaves |
| Fusarium head blight | 20–25°C | rainfall and moisture during flowering | rain during cereal anthesis |
| Grey mould (strawberry) | 15–20°C | moisture during flowering and fruiting | wet weather at fruit ripening |
| Cercospora leaf spot (beet) | 20–26°C | warm, humid days | first lesions on older leaves |
Source: FarmPortal, based on general epidemiological relationships from integrated pest management methodologies; thresholds should be confirmed against methodology for the specific crop and variety, as at June 2026.
How do disease models change crop protection?
A disease model converts fragmented observations into a single decision: treat now, wait, or schedule for a specific date. Rather than spraying every seven days, the grower responds to real risk calculated from field data.
The difference between a calendar approach and a model-based one is practical, not theoretical. A calendar has no knowledge of the dry, windy week that just passed and the low disease pressure that came with it. The model does – and it can defer or skip a treatment if conditions have not favoured the pathogen.
| Criterion | Calendar-based protection | Model-driven protection |
|---|---|---|
| Basis for decision | number of days since the last treatment | risk calculated from weather and growth stage |
| Response to weather | none | daily risk update |
| Risk of unnecessary treatments | high | lower, as each treatment has agronomic justification |
| Risk of late response | high in the event of sudden infection | lower, thanks to pre-symptom warnings |
| Documentation | often reconstructed from memory | linked to data and treatment records |
Comparative table, FarmPortal, as at June 2026.
The model has its limits, too. It cannot replace a walk through the field, and it will not identify a problem outside its scope – such as frost damage or a nutrient deficiency. Disease prediction supports decisions; it does not replace judgement. Models work best alongside field scouting and agronomic expertise.
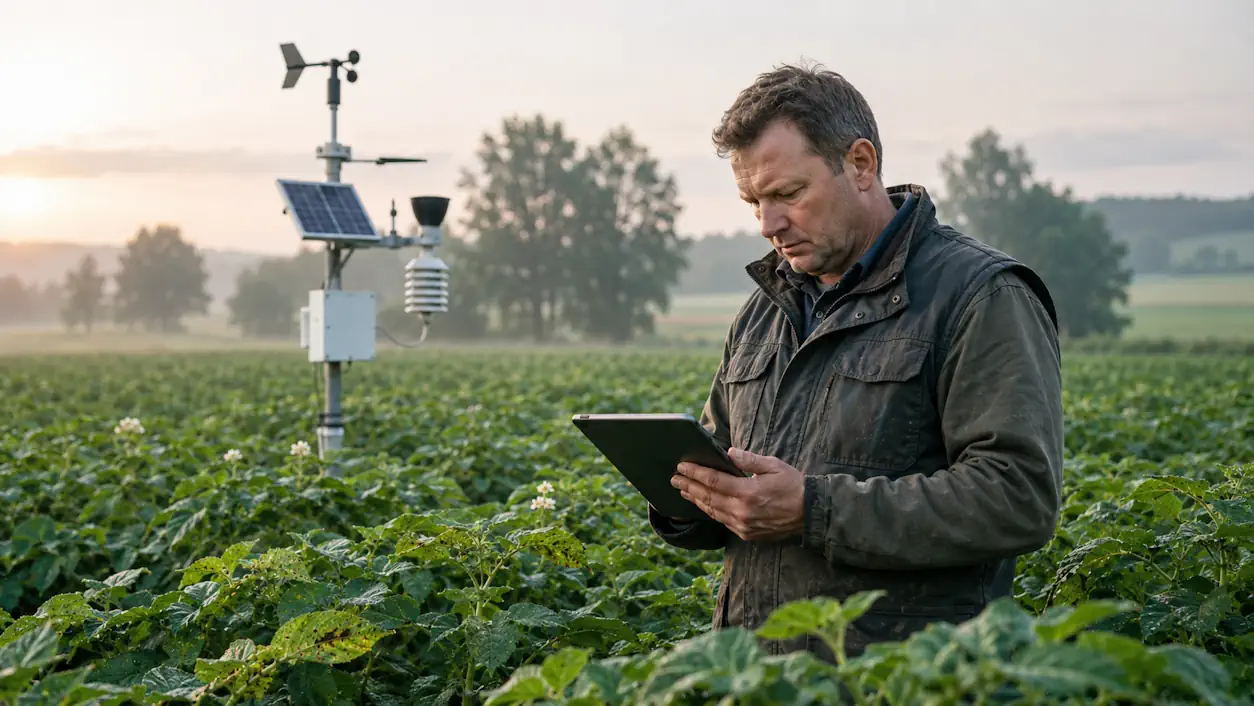
What data do you need to collect for the model to work?
A disease model is only as good as the data it receives. It needs weather measurements close to the field, information on crop growth stage, and a history of treatments and previous infections. Without this, it calculates risk from averaged regional data that rarely reflects conditions on a specific field.
In practice, several types of data are typically collected. Some come from equipment, some from human observation.
- Weather data from an agricultural weather station or virtual weather station: temperature, humidity, rainfall, and leaf wetness duration.
- Crop growth stage on the BBCH scale, which determines susceptibility to infection.
- Pest pressure data from insect traps and pheromone traps, combined with regular field scouting.
- Field history: previous infections, crop rotation, and treatments applied.
Trap data plays a distinct role here. It tracks the dynamics of pest immigration and provides indirect warning of diseases transmitted by insects. Combining weather measurements with trap counts gives a fuller picture than either source in isolation.
The longer a farm collects this data, the more valuable it becomes. After two or three seasons, repeating patterns emerge on specific fields, making it easier to identify which plots require more frequent monitoring.
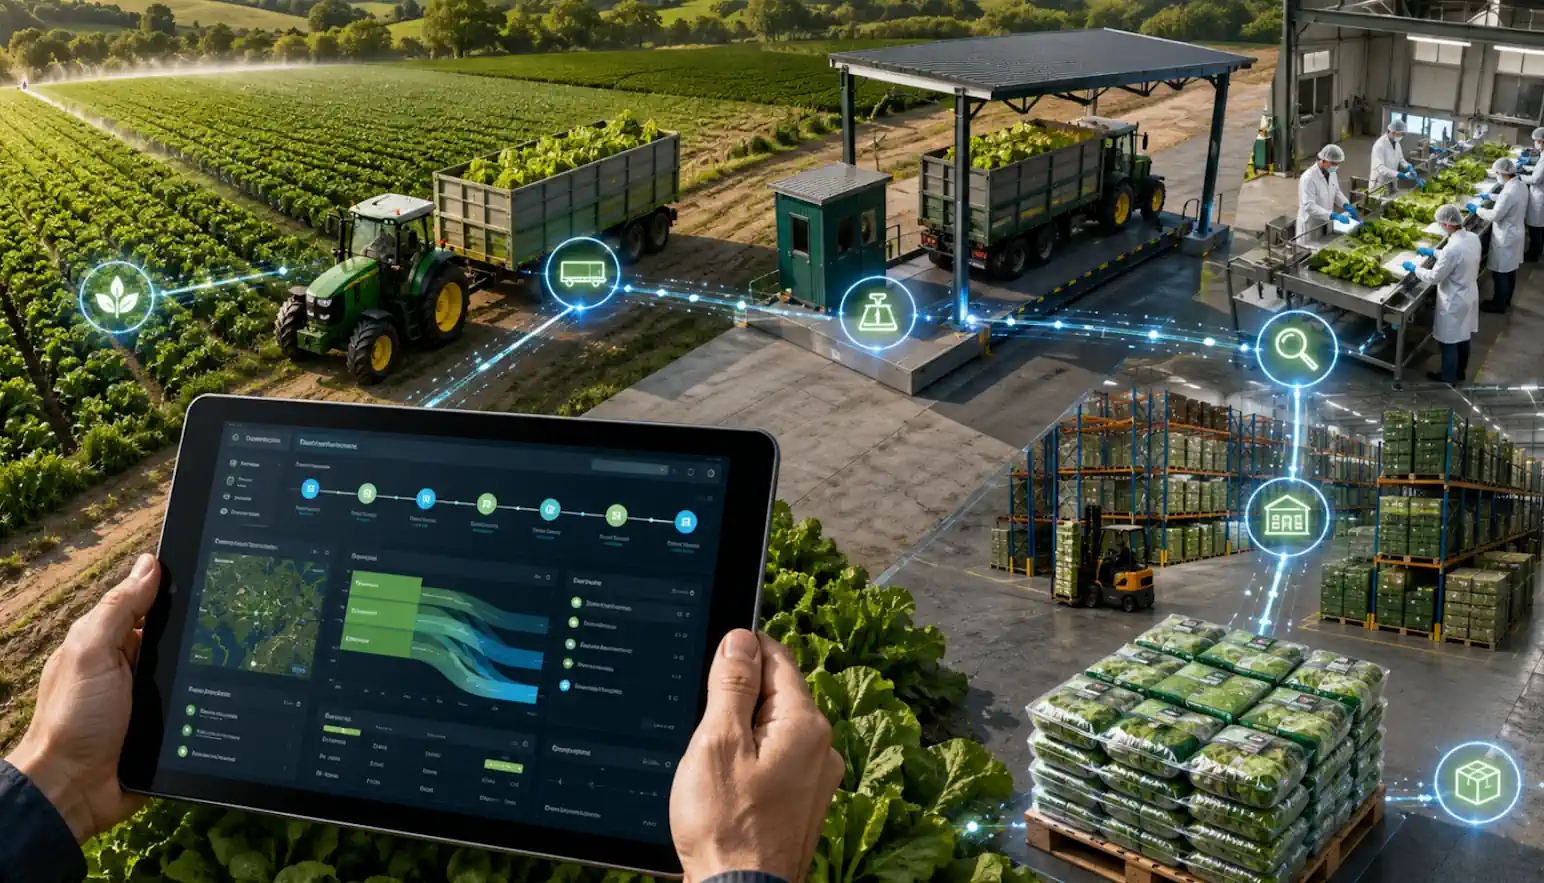
How does FarmPortal support disease monitoring and prediction?
FarmPortal organises the data needed to assess disease risk and links it to treatment records in one place. As a result, the protection decision and its documentation are not separate processes – both flow from the same field data.
In the context of June diseases, the following features are particularly relevant:
- integration with agricultural weather stations and weather data, including virtual stations for fields without physical sensors,
- a disease model and decision support module that converts weather data into risk scores for selected crops,
- crop monitoring and a log of field scouting results and insect trap counts,
- an agronomic treatment log linked to a specific field, date, and conditions,
- reports suitable for ARiMR inspections and integrated pest management documentation.
You can explore FarmPortal's treatment logging and crop monitoring features to see how these elements connect into a single data workflow. For a broader overview, the full FarmCloud ecosystem, of which FarmPortal is part, is worth exploring.
Where quality and traceability data need to travel further down the supply chain, FoodPass comes into play – collecting quality and traceability information for audits and buyers. For a farm working with a processor, this means that crop protection data does not stop at the field boundary; it can feed directly into delivery documentation.
In practice: a potato farm in Kujawy
Case study based on operational data and an Agri Solutions survey from the 2025 season; the figures relate to one farm and should not be generalised.
Context and scale. A family farm of 165 ha in Inowrocław county (Kujawy-Pomerania voivodeship). Cropping structure: 45 ha of table potatoes, 90 ha of winter wheat, and 30 ha of winter oilseed rape. Commercial production, with potatoes sold to a local buyer.
Problem. Blight management in potatoes was carried out on a calendar basis, on average every 7 days regardless of the weather. In wet years this created a risk of reacting too late; in dry years it meant unnecessary treatments and the associated costs of inputs and machinery.
Solution and data inputs. The farm installed an agricultural weather station next to the potato field and activated a late blight risk model in FarmPortal, based on temperature, humidity, and leaf wetness duration. Fields were scouted every few days during high-risk periods, and every treatment was recorded in the logging module.
Results in the 2025 season. The number of blight treatments fell from 9 to 6 over the season. The cost of potato protection fell by approximately 22% per hectare. The level of leaf infection remained low and comparable to the previous season, which had been managed on a calendar basis. The time needed to retrieve treatment records for inspection fell from several hours to a matter of minutes, as the data was already in the system.
| Indicator | Before (calendar) | After (disease model) |
|---|---|---|
| Number of blight treatments | 9 per season | 6 per season |
| Cost of potato protection | baseline | approx. 22% lower |
| Severity of leaf infection | low | low (no deterioration) |
| Time to prepare inspection records | several hours | a matter of minutes |
Source: farm operational data and Agri Solutions survey, 2025 season.
"What surprised me most was that two of the sprays simply weren't needed. The station and the model were showing low risk, so we held back. Blight never came, and we saved on both inputs and field passes."
Interpretive limitations. This covers one season and one farm. The 2025 season was moderately wet in this area, so in a year of heavy blight pressure the number of treatments could be higher. The results should not be applied directly to other crops or regions.
Takeaway for similar farms. The greatest value comes from combining three things: weather measurement close to the field, a risk model, and discipline in recording treatments. The model alone, without field data and scouting, is not sufficient.
Benefits for different audiences
Disease models offer different value to each group that works with crop data. Below is a brief summary of the challenge and the next step for each.
Commercial farmers and large-scale holdings
The main challenge is the cost and timeliness of protection across a large number of fields. The model helps prioritise treatments and skip those without agronomic justification. Next step: start with one weather station at the highest-risk crop and activate the risk model for it.
Agricultural advisers and extension services
An adviser manages multiple farms and needs a fast overview of risk across different fields. Model outputs and scouting records allow visits to be prioritised effectively. Next step: base recommendations on field-specific data rather than regional alerts alone.
Orchardists and strawberry growers
Grey mould and leaf diseases during flowering and fruiting are the key concerns here. Moisture within the canopy drives risk. Next step: monitor leaf wetness, reduce canopy humidity, and time treatments around the most susceptible growth stages.
Fruit and vegetable processors
Processors need consistent raw material quality and reliable traceability. Crop protection records from suppliers reduce the risk of rejected consignments. Next step: ask suppliers to maintain digital treatment logs and collect quality data in a consistent format – for example, through FoodPass.
Pre-season implementation checklist
This list helps you start with the most important steps, without overspending at the outset. The order is deliberate.
- Select the crop with the highest risk and economic value – typically potatoes, oilseed rape, cereals, or strawberries.
- Ensure weather measurement close to the field: your own station, or a virtual weather station for fields without a physical sensor.
- Activate the disease model for the selected crop and set alerts for elevated risk.
- Schedule scouting every few days during critical periods and record results in one place.
- Place insect traps where warranted and count catches regularly.
- Log every treatment with date, conditions, and product in the records module.
- After the season, review the data and flag fields that will need more frequent monitoring the following year.
Frequently asked questions
What are disease models in crop protection?
Disease models are algorithms that convert weather conditions and crop growth stage into an infection risk score for a specific pathogen. They operate within Decision Support Systems (DSS) and raise the alarm before symptoms appear. This allows growers to apply protective treatments when agronomically justified, rather than solely according to a fixed schedule.
Do disease models work well in June?
Yes – June is one of the most important months for these tools. Crops carry a heavy canopy, and warm, wet conditions favour infection. The model identifies critical periods for late blight, powdery mildews, rusts, and fusarium head blight, enabling a response before disease spreads across the field.
How much does it cost to implement weather station-based monitoring?
Cost depends on scale and equipment. An agricultural weather station typically requires an investment of several thousand PLN, while a virtual weather station needs no hardware in the field. Add to that the cost of software with disease models. It is worth weighing this against the value of a single treatment saved or a crop loss avoided – those are what determine the return.
How does calendar-based protection differ from model-driven protection?
Calendar-based protection relies on the number of days since the last treatment and does not respond to weather. A model calculates risk from field data and updates it daily. The practical outcome: fewer unnecessary treatments in dry spells and a lower risk of reacting too late during a sudden outbreak. The decision ceases to be a routine and becomes a response to evidence.
What data do you need to collect for a disease model to work?
You need weather data close to the field, the crop's growth stage on the BBCH scale, scouting results, and a history of previous infections and treatments. Trap catch data is also useful. The longer a farm accumulates this information, the more reliable the risk assessments become for individual fields.
Will a disease model replace field scouting?
No. A model supports decision-making but cannot detect problems outside its assumptions – such as frost damage or a nutrient deficiency. It works best alongside scouting and agronomic expertise. Predictions indicate when to go to the field and what to look for; observation confirms or corrects the risk assessment.
Does FarmPortal integrate with an agricultural weather station?
Yes. FarmPortal can draw on data from agricultural weather stations and virtual weather stations for fields without physical sensors. Weather data feeds into the disease model and is linked to the treatment log. This means the risk assessment and documentation are both produced from the same field data.
Where should a farm start with disease model implementation?
Start with the crop that carries the highest risk and the greatest economic value, and with weather measurement close to that field. Activate the model for that crop, set up alerts, and carry out regular scouting. After the first season, review the data and extend monitoring to further fields. A gradual rollout is cheaper and easier to sustain than trying to cover everything at once.
Glossary
- Disease model
- An algorithm that estimates infection risk based on weather conditions and crop growth stage. In practice, it indicates when a treatment makes agronomic sense before symptoms appear.
- Decision Support System (DSS)
- A tool that combines field data into a single action recommendation. In crop protection, it draws on disease models and weather data.
- Pest or pathogen
- Any organism harmful to plants: a fungal or bacterial pathogen, a pest insect, or a weed. Pest and disease monitoring is the foundation of integrated plant protection.
- Field scouting
- Direct observation of a crop to detect disease symptoms and pest presence. During critical periods it may be carried out every few days.
- Agricultural weather station
- A sensor measuring conditions close to the field: temperature, humidity, rainfall, and often leaf wetness duration. It supplies disease models with local data.
- Virtual weather station
- Point-specific forecast and weather data for a field without a physical sensor, generated by atmospheric models. It allows more fields to be covered by monitoring.
- Insect trap
- A device for catching and counting pest insects, such as a pheromone trap. It tracks pest immigration dynamics and supports assessment of disease pressure.
- Leaf wetness
- The duration for which water from dew or rainfall remains on leaf surfaces. The longer it persists, the greater the infection risk for many fungal diseases.
- Growth stage (BBCH scale)
- A standard describing the developmental stages of a crop. It determines susceptibility to specific diseases and informs the timing of treatments.
- Disease prediction
- A forecast of disease risk based on field and weather data. It serves to plan treatments, not to replace observation in the field.
Summary
June can determine the health of many crops for the rest of the season. Fungal and bacterial diseases develop quickly, and a calendar alone cannot keep pace with the weather. Disease models move decisions from routine to field-specific evidence, so treatments are applied at the moment of genuine risk.
This only works as a complete system: weather measurement close to the field, a risk model, regular scouting, and reliable treatment records. FarmPortal connects these elements into a single data flow, and when needed, FoodPass can carry quality and traceability data further along the supply chain. The simplest first step is one weather station at the most vulnerable crop and an activated disease model for it.
Follow us!
See what we're doing and be inspired by positive changes.