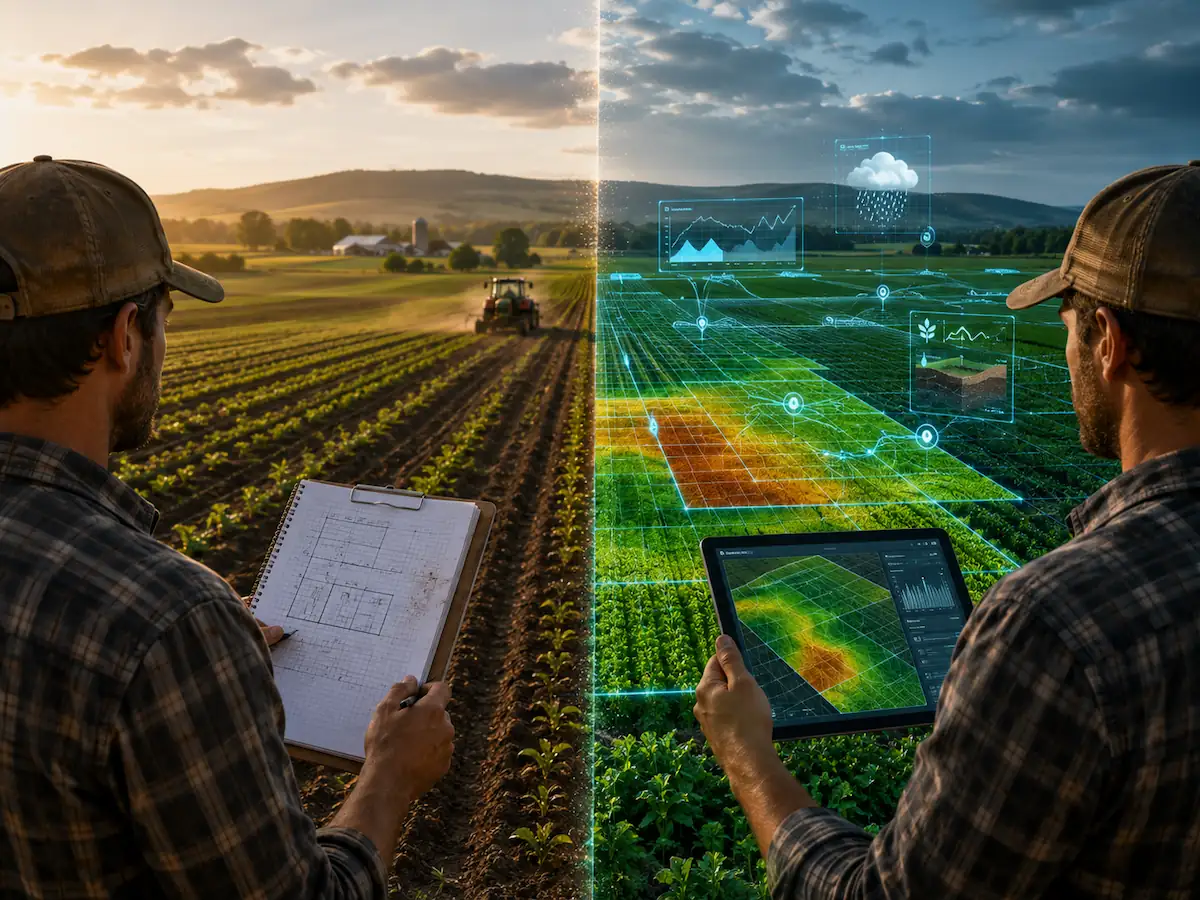
In practice, two types of weather stations are used:
- physical weather stations (in-field, on-farm) – direct measurement at a specific point, under real crop microclimatic conditions;
- virtual weather stations – data assigned to a location (e.g. a field), generated based on numerical models, gridded data, satellite observations and/or interpolation from station networks.
This article presents an operational comparison of these two approaches, addressed to agronomists, farmers, agricultural producers, and those responsible for production planning, risk assessment, and crop condition monitoring.
Physical weather station: characteristics and areas of advantage
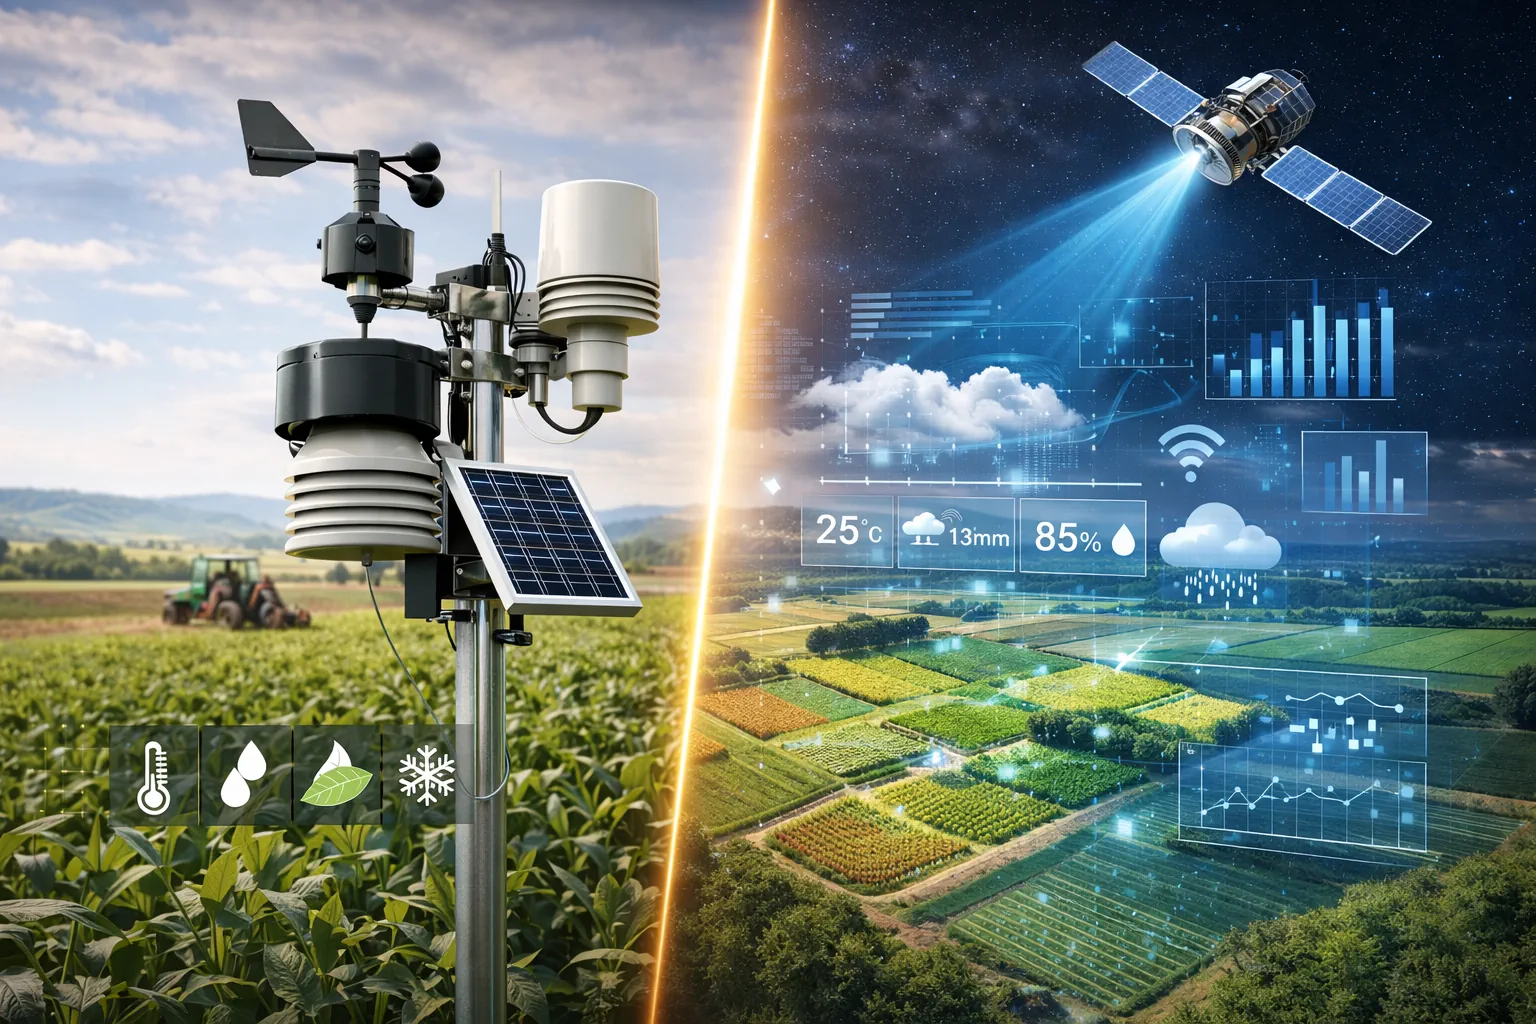
A physical, automatic weather station provides measurements that are as close as possible to the conditions prevailing within a farm, field, or plot. Its usefulness depends not only on the device class, but also on proper siting, installation quality, maintenance, and data quality control procedures. In practice, it constitutes an infrastructural asset of a farm or a processing facility that requires operation and servicing.
What is most commonly measured (and what matters for various models, e.g. disease, predictive, frost)
Typical sensors/parameters include:
- air temperature and relative humidity,
- precipitation (rain gauge), sometimes also rainfall intensity,
- wind speed and direction,
- radiation or sunshine duration (often used for ET0 calculations),
- leaf wetness – important in orchards and vegetable production for disease models,
- dew point, pressure,
- additional integrations: soil moisture and temperature, salinity, crop sensors, etc.
Practical significance: even moderate deterioration in data quality (poor location, improper radiation shielding, incorrect mounting height, obstacles limiting airflow) can lead to significant deviations in disease and frost model performance. Comparisons of data sources for orchard crops indicate that local measurements within the canopy/orchard directly affect model outputs (disease, frost), with data quality and measurement placement being critical.
Functional benefits of a physical station
- Microclimate representation: better reflection of differences at plot level (e.g. valley–ridge, forest edge, variable irrigation, windbreaks, protected cultivation).
- Short-lived phenomena: greater likelihood of capturing local episodes (convective storms, spot rainfall, fog, dew) relevant to infection pressure and treatment timing.
- Parameters difficult to estimate reliably: including leaf wetness and in-canopy conditions, as well as soil sensors.
- Data auditability: in contracting or insurance contexts, direct measurement data may be easier to justify than modelled data (depending on contract terms and methodology).
Operational limitations and risks
Dominant issues are maintenance- and environment-related:
- corrosion, UV degradation, flooding, frost, dust, insects, and degradation of housings and connectors,
- clogging of rain gauges and rainfall measurement errors during strong winds,
- sensor drift and the need for calibration and periodic inspections,
- risk of theft/vandalism and mechanical damage (machinery, animals),
- connectivity and power constraints (batteries, panels, GSM/LoRa/Wi-Fi).
Good practices regarding installation, site classification (siting), maintenance, and calibration are widely discussed in WMO guidelines and standards related to station placement and observation management.
Virtual weather station: definition, data sources, and areas of advantage
A virtual weather station is a data point assigned to a location (e.g. a field or plot), derived from computational infrastructure and external data such as weather models, gridded products, satellite observations, and interpolations from measurement networks. This solution is fast to implement, scalable, and relatively predictable in cost, but its limitations become particularly evident for local phenomena.
Virtual data sources (typical variants)
- Measurement- and interpolation-based gridded data – meteorological data presented in a regular spatial grid (e.g. every 1–5 km), derived from field station measurements and mathematical interpolation between stations. In practice, these are averaged estimates for each grid cell, with accuracy largely dependent on network density, topography, and parameter type (e.g. precipitation is usually harder to represent than temperature).
- Reanalyses and global/regional models (often useful for temperature and trends; in practice less stable for precipitation and extremes).
- Satellite products (e.g. precipitation) – useful, but requiring validation under local conditions.
- Platform services offering “virtual points” under subscription models (economic arguments and lack of hardware maintenance are typical; on-farm validation is recommended). In FarmPortal, up to 10 virtual stations are free of charge.
Advantages of virtual stations
- Scalability: the ability to assign data points to many fields without hardware investment or installation logistics.
- No field hardware maintenance: reduced risks related to corrosion, theft, inspections, and component replacement.
- Consistency of formats and data continuity: lower risk of data gaps due to field device failures.
- Rapid availability: setup often limited to specifying a location.

Limitations relevant from a user perspective
Comparisons of gridded data with field measurements show a typical pattern:
- temperature is often represented with relatively good quality,
- precipitation and humidity carry higher uncertainty (especially under local storms and point phenomena),
- extreme events (e.g. intense rainfall) are more difficult to represent reliably in gridded products in many regions.
Literature and quality analyses of gridded data for agrometeorological applications emphasize that accuracy depends on region, reference station density, topography, and variable type (temperature/precipitation/humidity).
Comparison for production decisions: parameters, models, and decision processes
In agricultural practice, the key factor is not “absolute” forecast accuracy, but the impact of data on decision quality: treatment timing, irrigation planning, frost protection, harvest planning, and infection risk assessment.
Comparison table (operational perspective)
| Area | Physical station | Virtual station |
|---|---|---|
| Field/plot microclimate | Highest representativeness with proper siting | Dependent on resolution and topography; averaging possible |
| Local precipitation (point phenomena) | Usually advantageous with proper rain gauge maintenance | Often higher local uncertainty |
| Humidity/dew/leaf wetness | Advantage (especially leaf wetness and in-canopy conditions) | Mostly estimates; higher uncertainty |
| Frost and radiative frost | Advantage in local depressions and orchards | Risk of underestimating local cold spots |
| Irrigation (ET₀, water balance) | Very good locally; requires service | Good for farm-level planning; weaker in soil/topography mosaics |
| Deployment cost | CAPEX + installation | Usually low entry threshold |
| Maintenance cost | Service, calibration, parts, failure risk | Subscription/service; no field hardware |
| Technical risks | Corrosion, theft, connectivity, sensor drift | Model/grid errors, vendor changes, limited method transparency |
| Scaling to many fields | Costly and logistically demanding | Usually cost- and organizationally efficient |
Data quality and accuracy: error sources and practical consequences
The question of “greater accuracy” requires clarification: accuracy should be assessed separately for individual variables and in the context of a specific agronomic decision.
Most common error sources in physical stations
- improper siting (shade, buildings, tree edges, incorrect mounting height),
- lack of periodic inspection and cleaning (especially for precipitation),
- sensor aging and drift (need for calibration and inspection).
Most common error sources in virtual stations
- spatial averaging (reduction of local variability),
- limited representation of precipitation and humidity in time and space,
- dependence on reference network density and topography (mountains, coasts, valleys).
Conclusion relevant for disease models
For models sensitive to humidity/leaf wetness and short-term phenomena (orchards, vegetables, potatoes, vineyards), local measurements often increase inference reliability, provided stations are properly maintained and data quality control procedures are implemented.
Total cost of ownership (TCO): purchase, subscription, service, and durability
In practice, lifecycle costs are driven not only by purchase, but also by maintenance: service, replacements, travel, failure risk, and data availability interruptions.
Physical station – typical cost components
- device purchase and installation,
- platform/data subscription (often applicable),
- service costs: cleaning, battery/component replacement, calibration,
- damage risks: corrosion, surges, mechanical damage, theft,
- durability: dependent on environmental conditions and maintenance quality; WMO guidelines emphasize the importance of siting, maintenance, and calibration for observation quality.
Virtual station – typical cost components
- data and model subscription/license (in FarmPortal, up to 10 virtual stations are offered free of charge together with decision support systems for spraying and irrigation),
- integrations (API, advisory platform, disease models),
- (negligible) validation cost: comparison with at least one reference is recommended (e.g. a farm station or the nearest network station).
User perspective
In accounts from FarmPortal users who operate both physical and virtual weather stations on farms, issues often arise around subscription costs, battery replacements as part of the service, and precipitation comparisons between concurrently operating devices. While not scientific evidence, these observations highlight areas most frequently perceived as operationally critical. Application descriptions, in turn, emphasize the usefulness of alerts (frost, treatments), data history, and decision support, which also require validation under farm conditions (e.g. pilot deployments).
Matching the solution to context: recommendations for typical scenarios
In implementation practice, hybrid solutions dominate: physical reference points supplemented by virtual coverage of the entire area.
Orchards, vegetables, vineyards (high microclimate sensitivity)
Recommendation: physical stations (at least 1–2 for key microclimates) plus virtual points for remaining fields/plots.
Rationale: humidity, leaf wetness, fog, and local frost can determine infection pressure and protection effectiveness.
6.2. Large arable farms, plot mosaics, need for scale
Recommendation: virtual points as the base layer + one physical station as a validation point and bias assessment.
Rationale: planning decisions can often be supported by gridded data, with recognition of higher uncertainty for precipitation and humidity.
Irrigation and water balance
- For precision irrigation management (plot/section, varying soils): local measurements are recommended (physical station and/or soil sensors).
- For farm-level planning: virtual data may be sufficient, but local validation is recommended, especially for precipitation.
6.4. Frost protection
Recommendation: when undertaking costly actions (anti-frost sprinkling, wind machines, heating), physical stations are preferred in critical locations.
Rationale: gridded products may not reflect local cold pockets (e.g. terrain depressions).
Most frequently asked questions by FarmPortal users
Are virtual data sufficient for disease models?
Often not for crops sensitive to humidity and leaf wetness, especially when infection risk depends on short time windows. In such cases, local measurements can significantly improve model inference, provided data quality is stable.
Why does the farm station measurement differ from weather app data?
Consumer apps and many services rely on models and gridded data that spatially average conditions. Differences are particularly common for precipitation and local events.
Does a physical station always provide better data?
No. A poorly sited and poorly maintained station can produce lower-quality data than a well-chosen gridded source. Therefore, siting, installation standards, and maintenance are critical.
Is it better to have one high-end station or several simpler ones?
Under strong microclimatic variability (e.g. orchards, vineyards, hilly terrain), several measurement points may provide higher decision value than a single high-spec station, as they reduce the risk of missing important spatial differences.
Final recommendation: selection methodology and investment risk mitigation
The most appropriate approach is to design the weather data architecture in agricultural production around specific decisions and risk profiles, rather than selecting technology for its own sake.
Weather station selection framework
- Which decisions are cost-critical? (frost, infections, irrigation, treatment windows)
- How high is local variability? (depressions, proximity to forest/river, soil mosaic, elevation differences)
- Are resources available for station maintenance? (service, quality control, response time to failures)
- Are specific parameters required (e.g. leaf wetness, in-canopy conditions)?
- Is scale critical (tens–hundreds of plots)?
Implementation recommendations: data architecture, number of points, and quality KPIs
Meteorological data implementation should be treated as part of decision infrastructure. The recommendations below aim to minimize the risk of incorrect decisions (protection, irrigation, frost) at a controlled total cost of ownership (TCO).
Architecture recommendations (baseline model)
- Hybrid model: virtual weather points as coverage layer + physical reference stations in critical microclimates.
- Bias validation: periodic comparison of virtual data with field reference (especially precipitation, humidity, temperature minima in depressions).
- Microclimate segmentation: design station numbers by microclimate type rather than total area.
Deployment scenarios (number of stations and justification)
A) Orchard / vineyard / intensive vegetables (approx. 10–50 ha)
- Physical stations: 1–2 units
- 1 in a representative plot,
- 1 in the highest-risk location (cold pocket or frequent fog/dew area).
- Virtual points: for each plot/block.
- Rationale: high microclimate sensitivity in disease and frost models and short decision horizons.
B) Arable farm (approx. 100–300 ha, plot mosaic)
- Physical stations: 1 unit (or 2 units if topographic differences > 30–50 m relative elevation or distinct soil/retention zones).
- Virtual points: for each plot.
- Rationale: virtual data support scale and consistency; the physical station serves as a reference (especially for precipitation).
C) Mixed / multi-location farm (approx. 500–2000+ ha, dispersed locations)
- Physical stations: 1 per location/field cluster (typically every 5–15 km), plus additional units in higher-risk zones (frost, intensive crops).
- Virtual points: full coverage.
- Rationale: virtual data ensure scalability; physical points reduce error risk in critical areas.
Data quality KPIs (minimum for production and risk management)
Without quality monitoring, decision value declines. Recommended KPIs (for both physical and virtual sources):
- Completeness: share of missing records over 24 h / 7 days (e.g. target > 99% for critical parameters).
- Timeliness: data publication delay (e.g. < 10–15 min for alerts).
- Plausibility checks: detection of non-physical or seasonally implausible values.
- Step change / spikes: detection of sudden jumps indicating sensor failure or transmission errors.
- Consistency: comparison with neighboring sources (virtual vs physical, optionally external reference), especially for precipitation and humidity.
- Bias trend: monthly/quarterly deviation analysis (sensor drift vs grid averaging).
Minimum service requirements (physical stations)
Most deployment failures result from lack of maintenance rather than technology limitations. Minimum recommendations for automatic weather stations:
- visual inspection: every 2–4 weeks during the season at the field or installation site,
- rain gauge: cleaning and flow check every 2–4 weeks and after dust/insect episodes,
- power and connectivity: monthly check, verification in FarmPortal that the farm weather station is transmitting data,
- calibration/verification: according to manufacturer recommendations (typically once per season or once per year for critical parameters),
- KPI anomaly response procedure: e.g. diagnosis within 24–48 h, sensor replacement within 7 days at critical locations.
Recommendations in the FarmPortal context: weather data sources and integrations
Selecting a platform that supports production and risk management is as important as selecting the data source itself. Recommended solutions integrate meteorological data, weather alerts, and crop context (plots, treatments, phenology, risk) in a single operational environment – e.g. a Farm Management System (FMS) such as FarmPortal or FoodPass. Weather station data is key in Agriculture 5.0 for alerts and decision automation.
Product information and FarmPortal capabilities:
- FarmPortal provides virtual weather stations free of charge (up to 10 per farm), anywhere on the map.
- FarmPortal integrates with physical stations from three manufacturers: Metos, Atmesys, and Silvergeko. Discussions are ongoing with FarmUnited to integrate German FarmSense weather stations, expanding the offering.
- FarmPortal offers free configuration of weather alerts for defined parameter thresholds (including risk events, infection-favorable conditions, treatment windows – depending on configuration).
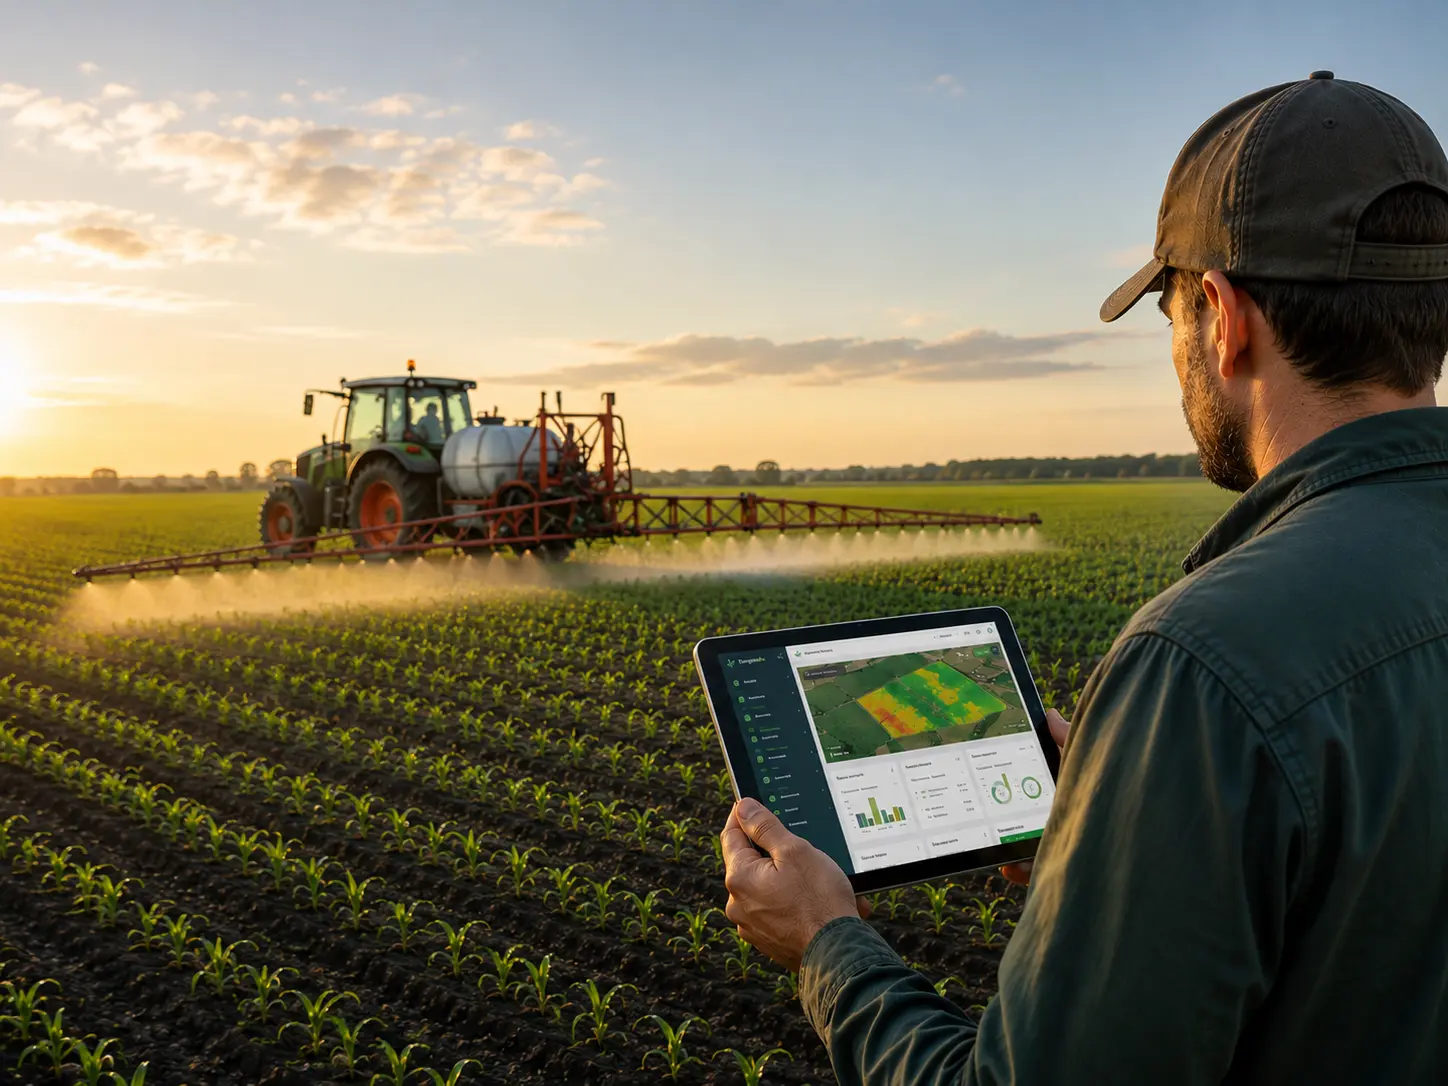
- Data from both virtual and physical weather stations are used to generate irrigation recommendations and determine spray timing.
- Weather data are assigned to each crop treatment, enabling verification of treatment effectiveness and justification.
- As with agrotechnical treatments, each field observation includes up to one week of historical weather data. Sharing field observations with photos, GPS position, crop data, and weather data with an agronomic advisor facilitates remote support and crop auditing.
Glossary (brief)
- CAPEX – capital expenditures (purchase and installation).
- OPEX – operational expenditures (service, connectivity, subscriptions).
- TCO (Total Cost of Ownership) – total cost of ownership over the solution lifecycle.
- ET0 – reference evapotranspiration, used e.g. for water balance calculations.
- Siting – rules for station and sensor placement in the field, determining measurement representativeness.
- Gridded data – spatially gridded (averaged) data products.
- Bias – systematic deviation of one data source relative to a reference.
- Reanalysis – reconstruction of weather conditions based on models and historical observations.
Follow us!
See what we're doing and be inspired by positive changes.