In brief
Variable-rate application is based on a recommendation map, which the machine reads during the operation. Its value does not come from the equipment itself, but from making a better agronomic decision in each field zone. Variable rates pay off where the field is genuinely diverse in terms of soil, yield potential, crop condition or pest and disease pressure.
- A recommendation map brings together soil data, satellite imagery, yield maps, field observations and machine data into one operational file for the terminal.
- Variable seeding changes plant population, variable-rate fertilisation changes fertiliser rate, and variable spraying changes the amount of crop protection product or section activation.
- The strongest economic case appears where field variability is repeatable, rather than a one-off effect of drought, frost or an operational error.
- ISOBUS, ISO-XML, SHP, GNSS and application maps form the practical bridge between an agronomic decision and the machine.
- FarmPortal supports work at different resolutions: from simple field zones and soil sampling grids to application maps matched to the capabilities of the terminal and machine.
What is variable-rate precision farming?
Variable-rate precision farming means that the decision on the amount of seed, fertiliser or crop protection product is assigned to a specific location in the field. Not to the whole plot. To a zone, pass, section, row or application-map cell.
In a conventional approach, a farmer applies one rate, for example 180 kg of fertiliser per hectare, across the entire field. In a variable-rate approach, the rate may be 130 kg/ha in a weaker zone, 180 kg/ha in an average zone and 220 kg/ha in a high-potential zone. The rate difference itself is not yet a success. The success lies in a justified agronomic decision.
The key argument of this article is simple: variable-rate application is not an add-on for “nice-looking maps”, but a tool for managing costs, yield and risk. If the map does not lead to a better decision in the machine, it remains a visualisation.

The term variable-rate precision farming is commonly described as Variable Rate Application (VRA). It includes variable seeding, variable-rate fertilisation, variable spraying, variable-rate liming, variable irrigation and other operations in which the rate can be controlled spatially.
What connects variable seeding, variable-rate fertilisation and variable spraying?
All three technologies are based on the same assumption: a field is variable, and the crop does not respond in the same way everywhere. They differ in the input and the machine used, but they rely on similar data, a similar zoning logic and a similar method of execution.
Variable seeding regulates plant population. Variable-rate fertilisation regulates the rate of a nutrient. Variable spraying regulates the amount of spray liquid, product or activated nozzles depending on biological pressure, weed infestation, canopy condition or weather conditions.
In practice, each of these technologies requires answers to four questions: where is the field different, why is it different, what rate makes sense there, and can the machine actually carry out that decision? It sounds simple. During the season, it rarely is.
The most common data sources include soil test results, yield maps, satellite imagery, NDVI and NDRE indices, field observations, soil scanning, machine data, field operation history, weather data and agronomic models. Satellite imagery alone is not enough for everything, because it is good at showing biomass variability, but it does not replace analysis of pH, phosphorus, potassium, magnesium, organic matter or micronutrients.
| Decision area | One rate for the whole field | Variable rate | Practical effect |
|---|---|---|---|
| Reference point | Average value for the whole plot | Zone, grid, section, pass or row | Fewer decisions made by eye |
| Input data | Farmer experience and a general recommendation | Soil, satellite, yield, weather, observations and machine data | Better justification for the rate |
| Risk | Over-fertilisation, under-seeding, excess spraying in part of the field | Map error, poor calibration, low-quality data | Control requires a process, not a one-off map |
| Documentation | Usually a declared rate for the field | Application map and as-applied map | Easier analysis of cost and effect |
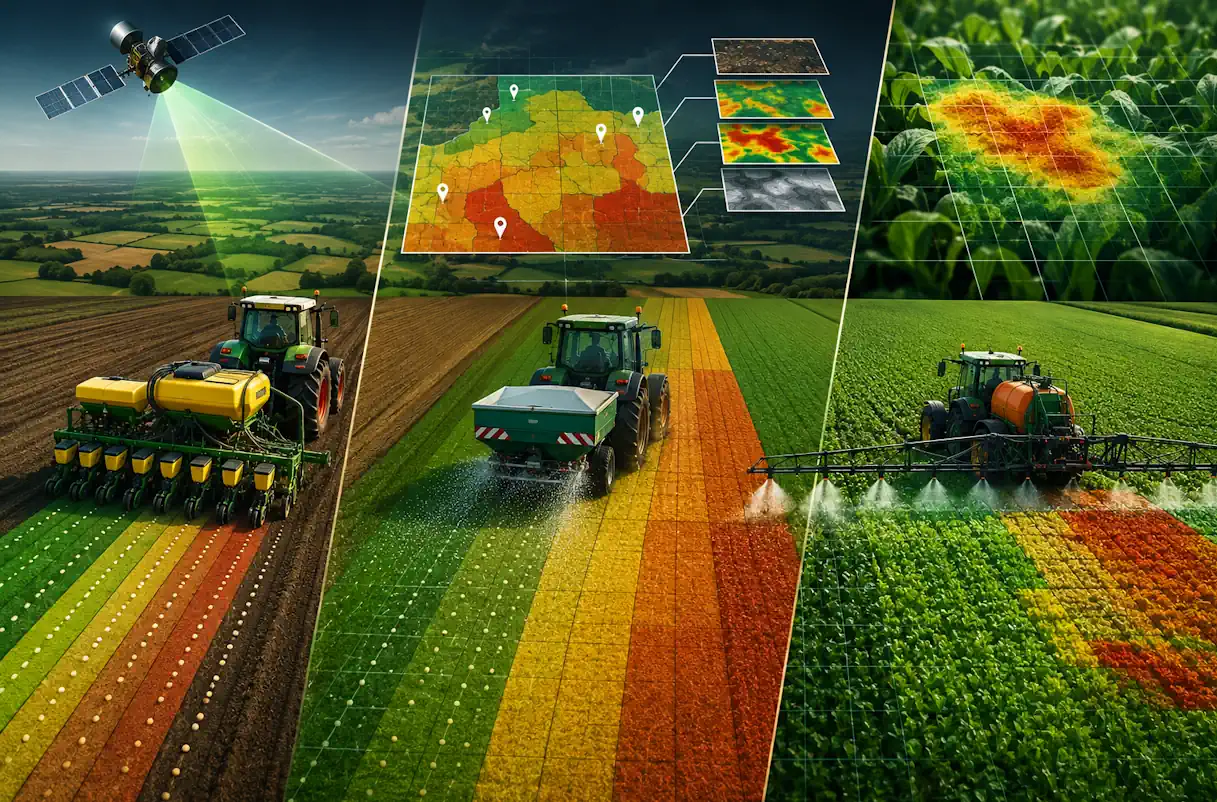
How does the process work from data to machine?
The variable-rate application process starts with data, but it only ends once the machine has carried out the operation and left a record of what was done. Without this, it is not possible to check reliably whether the map was correct or whether the decision delivered the expected result.
- Data collection. Data may come from soil analyses, yield maps, satellite imagery, NDVI and NDRE indices, weather stations, sensors, machine terminals, field applications and adviser observations.
- Field variability analysis. The system, adviser or agronomist divides the field into zones with different potential, nutrient status or problems. The number of zones should reflect real variability, not the desire to create a more impressive-looking map.
- Preparation of the recommendation map. A seed, fertiliser or crop protection product rate is assigned to each zone. The map must match the working width, sections, minimum and maximum rate, and terminal capabilities.
- Field execution. The drill, fertiliser spreader or sprayer uses GNSS position and the application map to change the rate during operation.
- Result verification. After the operation, as-applied data is compared with the recommendation map, product use, yield, quality and field observations.
In AEF documentation, Task Controller functions are linked, among other things, to work documentation, application maps, ISO-XML data and section control. From the farmer’s point of view, this means that the FMS, terminal and machine must understand the same way of passing on the task.
Without the final step, variable-rate application remains a single field operation. With a good data layer, it becomes part of the farm’s learning cycle.
Variable seeding: plant population matched to site potential
Variable seeding means changing the seed population per hectare within the same field. Higher-potential zones can receive more seed, while weaker zones can receive less in order to reduce competition for water and nutrients.
In maize and oilseed rape, variable seeding can be particularly interesting because seed is expensive and crop response to plant population can be strong. In cereals, the economic effect is usually harder to capture, but it can still make sense where there is clear soil variability, differences in moisture and a well-documented yield history.
The most common mistake is assuming that a higher plant population always means a higher yield. On a weaker part of the field, too high a population increases competition between plants, while in a stronger zone too low a population may fail to use the available potential.
A sensible variable seeding strategy requires a drill that can change the rate, a properly prepared map and verified compatibility with the terminal. The second condition is map quality. A map generated solely from one season of satellite imagery may reflect the weather in that particular year rather than the long-term potential of the site.
Variable-rate fertilisation: rate matched to soil and crop canopy
Variable-rate fertilisation adjusts fertiliser rate to soil nutrient status, crop requirements, yield target and current crop condition. For phosphorus, potassium, magnesium and lime, soil testing is usually the basis. For nitrogen, biomass, growth stage, weather patterns and site potential also matter.
The agronomic decision does not always follow the rule “more where it is weaker”. In winter wheat, oilseed rape or maize, the farmer often wants to increase the rate in the highest-potential zones and reduce it where additional fertiliser would not be used. In a weak zone, the issue may be pH, drought stress, soil compaction or a history of agronomic mistakes, rather than the fertiliser rate itself.
Variable-rate liming is one of the most intuitive applications of VRA. If pH within one plot ranges, for example, from 5.2 to 6.8, one average lime rate will be wrong for part of the field. Some places will receive too little, others too much.
Variable-rate fertilisation requires particular care when interpreting data. A single satellite image may show differences in the crop canopy, but it will not explain their cause. The farmer and adviser need to distinguish nutrient deficiency from drought stress, acidity, soil compaction, disease or delayed emergence.
Variable spraying: precision in crop protection
Variable spraying adjusts the amount of crop protection product, spray liquid or activated nozzles to the actual pressure from weeds, diseases, pests or crop condition. The greatest saving potential appears where the problem is not distributed evenly across the whole field.
In practice, several variants can be distinguished: zone-based spraying from a pre-prepared recommendation map, band spraying in crop rows, spot spraying with real-time weed detection, and decision-rate adjustment based on weather, disease models and field observations.
The most striking savings usually apply to herbicides and technologies that detect weeds in individual spots. In a 2024 Iowa State University Extension demonstration, precision spraying on five soybean fields covering a total of 415 acres achieved an average product saving of 76%, with a range of 43.9–90.6% between fields. Such a result is not a guarantee for other crops, but it clearly shows the potential of the technology where weed pressure occurs in patches.
With fungicides and insecticides, the decision is more difficult because disease and pest pressure changes over time. Economic thresholds, BBCH stage, humidity, temperature, leaf wetness, weather patterns and varietal resistance all matter. For that reason, variable spraying in crop protection should combine mapping, scouting and decision-support models.
Conditions during spraying must be monitored in every variant. Delta-T helps assess the risk of spray liquid evaporation and drift, but it does not replace the product label, local weather assessment or the operator’s experience.
Does variable-rate application make sense on every field?
No. Variable-rate application pays off where within-field variability is clear, repeatable and technically manageable. On a plot with uniform soil, stable yield and no zone-specific problems, the recommendation map may end up very close to a flat average rate.
A small field does not rule out variable-rate application. In orchards, vegetables, strawberries, blueberries or seed crops, even a few hectares may justify a more precise decision, because the cost of seed or planting material, fertilisation, crop protection and labour is high. In cereals grown on small, even plots, the payback threshold is usually higher.
A uniform field is also useful information. If soil tests, satellite imagery and yield history do not show significant differences, the money may be better spent on correcting pH, changing the variety, adjusting the sowing date, irrigation, better machine guidance or improving soil structure.
First diagnose variability. Then build the map.
How much can realistically be saved?
The scale of savings depends on field variability, the quality of the recommendation map, the price of the input, execution accuracy and the purpose of the operation. There is no single figure that can honestly be promised to every farm.
In nitrogen fertilisation, scientific literature shows that variable rates can reduce nitrogen use, but the effect depends on the field and the season. In spot spraying, results can be higher, particularly for herbicides, but they usually relate to specific camera-based technologies and defined weed pressure.
| Operation | Main benefit | Example metric | Minimum condition | Limitation |
|---|---|---|---|---|
| Variable seeding | Better matching of plant population to site potential | plants/ha, seed cost PLN/ha, yield t/ha | zone map, drill with rate control | limited effect on a highly uniform field |
| Variable-rate nitrogen fertilisation | Better nitrogen use and reduced losses | kg N/ha, cost PLN/ha, yield t/ha, protein % | biomass maps, field history, spreader with rate control | strong dependence on weather and growth stage |
| Variable-rate liming | pH correction where it is actually needed | pH, t CaO/ha, cost PLN/ha | pH testing by grid or zones | requires good soil sampling |
| Zone-based variable spraying | Lower product use where pressure is low | l/ha, crop protection cost PLN/ha, % of treated area | pressure map or scouting | not suitable for every infection or every treatment |
| Spot spraying | High herbicide savings where weeds occur in patches | % product saving, cost PLN/ha | camera, weed recognition system, precise nozzle control | high equipment cost and dependence on visibility conditions |
The safest way to assess farm-level profitability is across three levels: input use, yield effect and decision documentation. Sometimes the greatest value is not the saving in product itself, but discovering that the problem in a given zone is not the rate, but pH, soil compaction, waterlogging or poor operation timing.
How does FarmPortal support variable-rate application?
FarmPortal treats variable-rate application as a process, not as a single function. The platform supports field variability analysis, work with satellite imagery, soil tests, fertiliser calculations, recommendation maps, field operation documentation and field history. A full description of the modules is available on the FarmPortal farm management functions page.
From a practical point of view, four elements matter most.
First, data sources. FarmPortal brings together satellite imagery, soil analysis results, cropping history, agronomist observations, weather data, field operations and field information in one view. As a result, the recommendation map is not built from a single signal, but from a data layer.
Second, resolution. The farmer or adviser can work with simple zones, soil sampling grids or more detailed application maps. For an older fertiliser spreader with a slower metering response, an excessive number of zones makes little sense. For a modern sprayer with accurate section control, higher resolution may be worth considering.
Third, terminal integration. FarmPortal can prepare data for work with terminals from different manufacturers, provided that the machine, terminal and file format support the given scenario. In practice, formats such as ISO-XML and SHP are used, and before implementation it is necessary to check the compatibility of the specific set-up: tractor, terminal, drill, fertiliser spreader or sprayer.
Fourth, decision support. FarmPortal supports crop monitoring, fertiliser calculations, Delta-T calculation, field operation planning and documentation. Decisions, not the mere fact of using a variable rate, determine the economic result.
| Element | Conventional approach | Approach with FarmPortal and VRA |
|---|---|---|
| Fertiliser rate | One rate for the whole field | Zone-based rate informed by soil, crop canopy and yield target |
| Spraying decision | Usual date and average rate | Decision supported by monitoring, weather, Delta-T and pressure map |
| Documentation | Notes, spreadsheet or field operation notebook | Field history, recommendation map, as-applied map and operation report |
| Work with an adviser | Phone call, photos and description of the problem | Shared field view, comments, data and decisions in one system |
| Season analysis | Difficult comparison of cost, rate and yield | Ability to compare recommendations, execution, use and result |
Within the broader FarmCloud ecosystem, data from FarmPortal can be connected with telemetry, sensors, external systems and analytical tools. For companies working with farms, such as processors or adviser networks, this data layer makes it easier to standardise processes, control quality and build a history of cooperation with suppliers.
What do farmers, fruit growers, advisers and processors gain?
Each group looks at variable-rate application differently. Farmers focus on cost and yield, fruit growers on quality and row-level precision, advisers on a repeatable recommendation process, and processors on stable supply and better control of raw material.
Farmers
For farmers, the main problem is the rising cost of seed, fertilisers, fuel, services and crop protection products. The motivation is to reduce losses where the rate does not work and to increase the effect where the field has potential. After reading the article, the farmer should be able to identify which fields should first be diagnosed for variability.
Fruit growers
In orchards and berry crops, marketable quality, fruit uniformity, disease pressure, water and microclimate are key. Variability often runs along rows, blocks, varieties, irrigation systems and soil differences. Decisions are more local.
ODR advisers and private advisers
Advisers need a process that turns field observations and agronomic knowledge into a recommendation that can be executed by a machine. The adviser’s language is rate, timing, BBCH stage, nutrient status, pH, risk, cost and expected crop response.
Fruit and vegetable processors
A processor usually does not carry out the field operation, but feels the impact of raw material quality. For processors, variable-rate application matters as part of stabilising supply, reducing residue risk, improving traceability and documenting supplier practices.
Case study: an arable and oilseed rape farm in Kujawy
Implementation example: a 380 ha farm in Kujawy grows winter wheat, winter oilseed rape, grain maize and sugar beet. The soils are mainly good and very good wheat complexes, but on three fields covering a total of 96 ha there is a clear soil mosaic, including weaker areas that periodically suffer from drought stress.
The problem was uneven yield and the difficulty of setting one nitrogen rate for the entire field. In weaker zones, lodging and lower fertiliser-use efficiency appeared, while in stronger zones the crop did not use its full potential. The farm did not want to reduce the rate across the whole field, because that would mean losing yield in the best areas.
The implementation covered variable-rate nitrogen fertilisation and variable seeding of maize across 220 ha. Recommendation maps were prepared using three groups of data: yield maps from the previous two seasons, NDRE satellite imagery from the growing season, and soil analyses carried out on a denser grid in the most variable fields.
Three fertilisation zones were used in oilseed rape, and five plant population zones in maize. The nitrogen rate ranged from 160–230 kg N/ha, and maize population ranged from 75,000–95,000 seeds/ha. The data was exported to a terminal capable of handling application maps, and file compatibility was checked before going into the field.
After two seasons, average nitrogen use in oilseed rape fell by around 9% while yield was maintained, and maize seed use fell by around 7%. The most important effect, however, was not the saving itself, but the identification of zones where a higher rate did not solve the problem. Those areas required pH correction, improved soil structure and a change in canopy management.
The result should not be transferred directly to other farms. It is a scenario showing what implementation may look like on a farm with a clear soil mosaic, suitable equipment and several seasons of data history. On uniform fields, the order should be different: diagnose first, then apply VRA.
Frequently asked questions
Does variable seeding make sense on a uniform field?
On a field with uniform soil and stable yield, variable seeding usually does not deliver a clear economic effect. The recommendation map then comes close to an average rate. In such conditions, money is often better spent on seed quality, pH correction, precise drill calibration or improving the sowing date.
Does variable-rate fertilisation pay on a small field?
Variable-rate fertilisation can pay on a small field if there is clear variability in soil, pH, nutrient status or moisture. In high-value crops such as vegetables, berry fruit or orchards, even a few hectares may justify more precise recommendations. In cereals, the payback threshold is usually higher.
When does variable-rate fertilisation really pay?
Variable-rate fertilisation most often pays where the field is spatially variable, historical data exists, and the equipment can execute an application map without major additional costs. The strongest effect is seen in nitrogen fertilisation of cereals, oilseed rape and maize, as well as in liming. Without reliable data, the map loses value.
How much can be saved with variable spraying?
Savings from variable spraying depend on weed, disease or pest pressure, the type of technology and operating conditions. In a 2024 Iowa State University Extension demonstration, precision herbicide spraying on five soybean fields achieved an average product saving of 76%, but this is not a guarantee for other crops.
What is the minimum data needed to start variable-rate application?
The minimum set includes field boundaries, cropping history, previous operations, the current crop, soil test results and machine data. It is also worth adding satellite imagery from several dates, yield maps, field observations, local weather data and information on problems such as drought, waterlogging, weeds or soil acidity.
Does FarmPortal support variable seeding, spraying and fertilisation?
Yes. FarmPortal supports variable-rate fertilisation, variable seeding and variable spraying through field management, satellite imagery, soil testing, fertiliser calculations, crop monitoring, variability zones, field operation documentation and preparation of data for terminals from different manufacturers. The execution scope depends on the data, map format and capabilities of the specific machine.
Can an agricultural adviser work with maps in FarmPortal?
Yes. An adviser can use the field view, field operation history, observations, soil test results and recommendation maps. This makes it easier to prepare recommendations, discuss them with the farmer and assess results after the season. The greatest value is a shared data base that reduces work across scattered photos, phone calls and spreadsheets.
Does variable-rate application help with ARiMR documentation?
Variable-rate application can help with documentation because an operation carried out from a map leaves a digital record: time, field, rate, product, machine and operator. Such data makes it easier to prepare field operation records and internal reports. It does not, however, remove the need to check entries before submitting documentation.
Glossary
- VRA (Variable Rate Application)
- Variable application of an input within the same field. It includes, among other things, seeding, fertilisation, spraying, liming and irrigation.
- Recommendation map
- A file that divides the field into zones and assigns a rate to each one. It can be used by the machine terminal to carry out a variable-rate operation.
- Application map
- The practical version of a recommendation map prepared for execution by the machine. It must be compatible with the terminal, data format and equipment capabilities.
- As-applied map
- A map of the operation as it was actually carried out. It shows where and at what rate the input was applied, allowing the plan to be compared with execution.
- ISOBUS (ISO 11783)
- A communication standard between tractor, terminal and agricultural implement. It supports the operation of equipment from different manufacturers and the exchange of operational data.
- ISO-XML
- A data exchange format used within the ISOBUS ecosystem. It can carry tasks, field boundaries, recommendations and as-applied documentation.
- NDVI
- A vegetation index used to assess crop condition and biomass. It helps identify differences in the crop canopy, but requires agronomic interpretation.
- NDRE
- A vegetation index often used to assess crop condition at more advanced growth stages. It can be useful for nitrogen fertilisation decisions.
- GNSS RTK
- Precise satellite positioning with correction, used for machine guidance and accurate execution of field operations.
- Delta-T
- The difference between air temperature and wet-bulb temperature. In spraying, it helps assess the risk of spray liquid evaporation and drift.
Summary
Variable seeding, variable-rate fertilisation and variable spraying are three different field operations with the same logic: it is better to match the rate to the actual needs of a part of the field than to apply one average rate across the whole plot. The core of the approach is not the technology itself, but an agronomic decision based on data.
On a uniform field, the same technology will not deliver a major effect and should not be implemented for its own sake. First, the variability must be understood, field history organised, and pH, nutrient status, yield performance and machine capabilities checked. Only then is it worth preparing an application map.
FarmPortal connects data sources, supports zone creation, fertiliser calculations, crop monitoring, Delta-T calculation, field operation documentation and the preparation of data for terminals from different manufacturers. This means variable-rate application does not have to be a one-off experiment. It can become part of digital field potential management across multiple seasons.
Follow us!
See what we're doing and be inspired by positive changes.