Brief summary
Digital agriculture in Agrostrateg T3 is an area for projects that combine data from farms, sensors, machinery, satellite imagery, drones, IoT systems, image analysis and artificial intelligence. The best projects do not stop at creating an application. They lead to a tested solution that improves the efficiency of crop or livestock production, reduces resource use and delivers measurable implementation effects.
This article shows what kinds of projects can be prepared under thematic area T3, why it is worth building research and industry consortia, and how to use the experience of FarmPortal, FarmCloud, FoodPass and Agri Solutions. The article is intended for farmers, machinery manufacturers, agronomists, agricultural advisors, processors, distributors and management teams in agri-food companies.
Key facts for T3 projects
AGROSTRATEG rewards projects with real implementation potential, based on data and addressing specific agricultural production problems. In practice, this means combining research, technology, piloting, validation and a commercialisation model.
- Main search intent of the article: how to prepare a project in the “digital agriculture Agrostrateg” area.
- Key technologies: FMS, IoT, GNSS, remote sensing, AI, computer vision, robotics, VRA, digital twin, interoperability, traceability.
- Greatest value for the farmer: fewer decisions made “by eye”, more decisions based on data, documentation and production economics.
- Greatest value for the consortium: combining science, farm data, IT technology, machinery and a route to implementation.
- Role of FarmPortal: the operational data layer for farms, fields, treatments, machinery, costs, sensors, reports and cooperation with advisors.
Who this article is for and what problems it solves
Projects in thematic area T3 are not intended only for research organisations. In practice, they require the involvement of end users, technology companies, machinery manufacturers, advisors, pilot farms and entities that face a real production problem.

The strongest opportunities lie in projects that solve measurable problems: excessive fertiliser use, lack of data interoperability, manual treatment reporting, poor yield predictability, difficulty managing animal welfare, lack of traceability or low irrigation efficiency.
| Target group | Problem | Benefit from a T3 project | Example implementation effect |
|---|---|---|---|
| Farmers and commercial farms | Scattered data, high costs of fertilisation, water, fuel and labour | Better decisions based on field, machinery, weather and treatment history data | Prescription maps, weather alerts, digital documentation, cost-per-hectare control |
| Agricultural machinery manufacturers | Closed machinery data and difficulty integrating with farm systems | Development of digital services, telemetry, VRA, automated work reports and remote service | Machinery as a data source for FMS and decision-support systems |
| Agronomists and agricultural advisors | Lack of full decision context: soil, weather, treatments, costs and yield | Remote advisory, validation of recommendations, better documentation and auditability of advice | Advisory based on field history, maps, risk analysis and measurement data |
| Processors, distributors and management teams | Lack of predictability of raw material quality and availability | Traceability, supply forecasts, digital contracting, quality and emissions monitoring | Digital batch passports, integration of farm data and reports for buyers |
Table 1. Main target groups for Agrostrateg T3 projects and the problems that digital agriculture projects can solve.
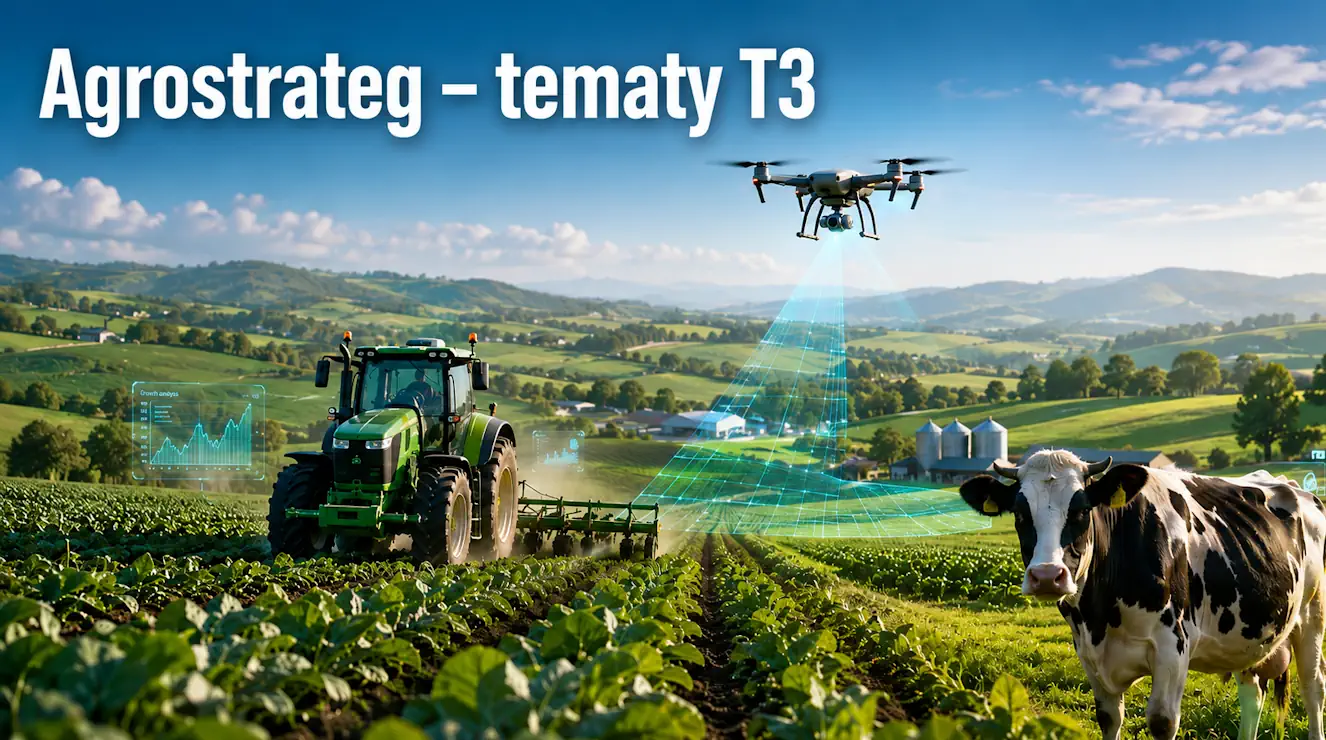
What thematic area T3 means in the AGROSTRATEG programme
Thematic area T3 of the AGROSTRATEG programme concerns digital agriculture, meaning the use of technology and data analytics to optimise crop and livestock production. In practice, it covers solutions that combine data from fields, farms, machinery, animals, sensors, satellites, drones and IT systems.
Not every IT project fits the logic of T3. Simply creating a note-taking app, a basic database or a reporting dashboard is usually not enough. The project should include a research or development component: a new data model, algorithm, integration, recommendation method, validation method or prototype that improves production under real operating conditions.
Thematic scope of T3 in practice
The scope of T3 can be reduced to twelve main streams. Each of them may be a standalone project or part of a broader digital platform for farms, producer groups, processors or machinery manufacturers.
- Real-time farm management software.
- Precision planting, sowing and irrigation.
- Remote sensing and geolocation.
- Intelligent application of fertilisers and crop protection products.
- Precision livestock production.
- Autonomous field robots and Agriculture 4.0.
- Advanced irrigation methods.
- Chemical product management and emissions reduction.
- Soil and water monitoring.
- Integrated Big Data and AI platforms.
- Data systems and interoperability.
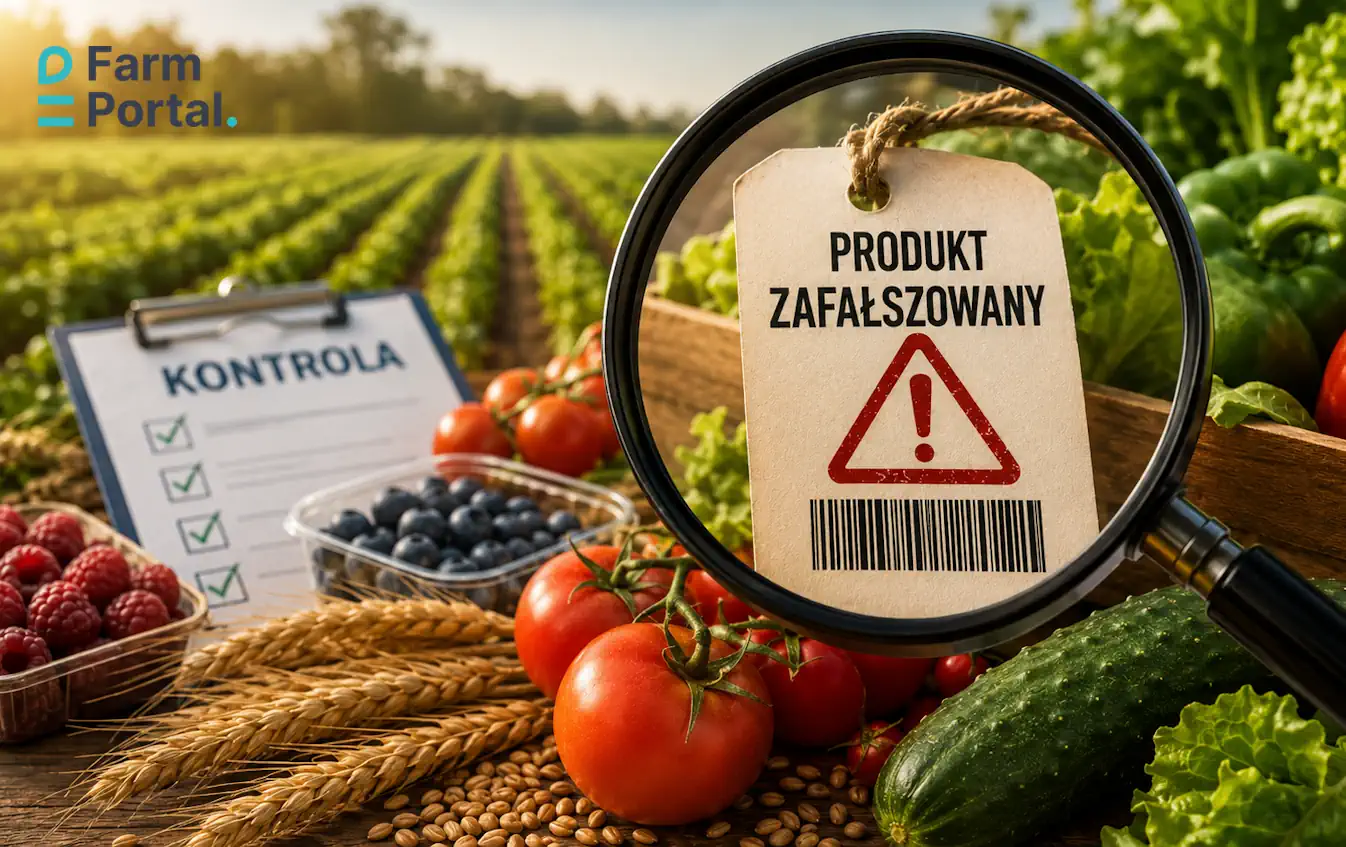
- Traceability and the value chain.
Digital agriculture is not an end in itself. It is a tool for achieving a production, economic, environmental or organisational effect. That is why a strong proposal must show not only the technology, but also a measurable problem and a way to validate the result.
Why T3 projects should be implemented by consortia
Digital agriculture requires competences that are usually not available within a single organisation. A farm understands the problem and has field data. A research unit designs research methods and validation. An IT company builds the system, integrations and data models. A machinery manufacturer provides telemetry, control systems and knowledge of equipment operation. An advisor or agronomist interprets results in the context of production practice.
This is why a consortium should not be a random set of partners. It should be built around the value chain: from the field problem, through data and algorithm, to implementation on a farm, in a machinery company, producer group or processing plant.
Optimal composition of a T3 consortium
The best composition depends on the topic, but in digital projects a four- or five-partner model often works well. It is important that each partner has clear responsibility and provides data, competences or infrastructure that cannot be easily replaced.
- Research unit: methodology, validation, agronomic models, statistical analysis, publishability of results.
- Technology company: data architecture, application, integrations, AI, IoT, cybersecurity, scalability.
- Pilot farms: real data, test fields, treatments, observations, usability assessment.
- Machinery or sensor manufacturer: machinery data, communication protocols, automation, hardware, service.
- Processor or distributor: quality requirements, traceability, contracting, demand for data and implementation model.
What a consortium contributes to project evaluation
A consortium increases project credibility because it shows that the solution is not just a laboratory concept. If an end user participates in the project, the technology can be tested on real data and assessed in day-to-day work.
In T3 projects, it is particularly important that the consortium has access to historical and current data: treatments, yields, soil, weather, sensors, prescription maps, machinery data, production batches and quality information. Without this, it is difficult to prove the advantage of a new method over the current way of working.
What research topics in digital agriculture should look like
A research topic in T3 should start with a gap, not with a list of features. The gap may concern lack of data, lack of an integration standard, lack of a recommendation model, low forecast accuracy, difficulty validating animal welfare or the challenge of transferring results from the laboratory to the farm.
A well-described research topic answers three questions: what we cannot do well enough today, what method will be developed in the project, and how it will be proven that it works better than existing solutions.
7 features of a strong T3 research topic
The following guide helps to quickly assess whether the topic is sufficiently research and development oriented. If a project meets most of the criteria, it is more likely to look like a T3 project rather than a standard IT implementation.
- Research gap: the project solves a problem that cannot be addressed by simply configuring an off-the-shelf system.
- Real data: the system is trained, tested or validated on data from fields, animals, machinery, sensors or processing operations.
- Model or method: a new algorithm, data model, recommendation method, validation procedure or integration is created.
- Pilot: the solution is tested on farms, machinery, in barns, orchards, plantations or processing plants.
- Measurable KPIs: the project includes indicators such as forecast accuracy, water-use reduction, documentation-error reduction or improved disease detection.
- Interoperability: the solution can combine data from different sources and does not create another closed data island.
- Implementation: the project result can be used commercially by farmers, advisors, machinery manufacturers, processors or distributors.
Example KPIs for T3 projects
Indicators should be tailored to the topic, but they must be measurable. A good practice is to compare the starting situation with the situation after prototype implementation, so that the change is visible.
| Project area | Example KPI | How to measure it | Data source |
|---|---|---|---|
| Yield forecasting | Forecast error MAPE ≤ 15–20% mid-season and ≤ 10–12% before harvest | Comparison of forecast with actual harvest | FarmPortal, harvest data, satellite data, weather data |
| Variable-rate fertilisation | Fertiliser-use reduction of 8–20% without yield loss | Comparison of application rates and yield in control zones | Soil tests, prescription maps, treatment records |
| Irrigation | Water-use reduction of 10–25% while maintaining crop quality | Comparison of water use, soil moisture and quality parameters | Moisture sensors, weather stations, plot data |
| Animal welfare | Increase in health-event detection by 20–30% | Comparison of AI alerts with veterinarian observations | RFID, 3D cameras, activity sensors, treatment history |
| Traceability | Shortening the time needed to reconstruct batch history from several hours to several minutes | Audit test on production batches | FoodPass, FarmPortal, harvest data, warehouse, transport |
Table 2. Example KPIs for Agrostrateg T3 projects. Values should be adapted to the crop, pilot scale, data quality and TRL level.
Top 12 example Agrostrateg T3 projects
The following proposals are examples of topics that can be developed into research and development projects. Each topic includes a problem, research challenge, innovation and potential use of the experience of FarmPortal, FarmCloud, FoodPass or Agri Solutions.
The best topics should be adapted to a specific consortium. A project for a sprayer manufacturer will look different from a project for a vegetable producer group or for a university studying soil, water and the environment.
| No. | T3 topic | Example project | Research challenge | What is innovative | Role of FarmPortal / FarmCloud / FoodPass |
|---|---|---|---|---|---|
| 1 | Real-time farm management software | DSS platform for vegetable farms combining treatments, weather, sensors, costs and agronomic recommendations | Combining data from multiple sources into one decision model and reducing manual data entry | A treatment recommendation model that considers field history, weather, costs, disease risk and crop development stage | FarmPortal as an FMS for recording fields, treatments, costs and reports; FarmCloud as the data integration layer |
| 2 | Precision planting, sowing and irrigation | A system for planning plant density and drip lines based on fertility, moisture and yield-potential maps | Determining the optimal plant density and water dose for field zones with different potential | An algorithm combining soil maps, satellite data, yield history and variety parameters | FarmPortal as a database of fields, plots, treatment history and integration with soil irrigation monitoring |
| 3 | Remote sensing and geolocation | Early detection of water stress and diseases in berry crops using satellites, drones and field observations | Distinguishing water stress, nutrient deficiencies and disease pressure based on multiple data sources | An anomaly classification model combining NDVI, weather data, drone images and agronomist notes | FarmPortal as a system for recording observations, maps and activity history on plots |
| 4 | Intelligent application of fertilisers and crop protection products | Variable-rate fertiliser and spraying system with validation of actual machinery execution | Combining agronomic recommendation with a prescription map and treatment execution record | A closed loop: diagnosis → prescription map → execution → report → model correction | FarmPortal supports precision fertilisation, satellite imagery, soil tests, fertiliser database and treatment history |
| 5 | Precision livestock production | AI for early detection of cattle health disorders based on 3D cameras, RFID and feeding data | Combining behavioural, feeding and health data into a risk model | An individual animal profile and predictive alert before visible clinical symptoms appear | FarmCloud as a data integration layer for IoT and AI; Agri Solutions’ experience in data models and image analysis |
| 6 | Autonomous field robots and Agriculture 4.0 | A robot for mechanical weeding in vegetable crops, integrated with field maps, cameras and treatment reporting | Safe robot operation in variable field conditions and validation of weeding effectiveness | Combining computer vision, geolocation, row maps and treatment reports in an FMS | FarmPortal as a layer for work planning, location, treatment records and effect reporting |
| 7 | Advanced irrigation methods | Dynamic drip-irrigation control system for orchards and berry plantations | Matching the water dose to soil, phenological stage, weather and forecast stress | A water-dose recommendation model based on moisture sensors, microclimate and weather forecast | FarmPortal integrates soil irrigation monitoring, weather stations and plot history |
| 8 | Chemical product management and emissions reduction | Digital balance of fertilisers, crop protection products, fuel and emissions for farms supplying raw material to processors | Standardising data on input use and converting it into environmental indicators | Combining treatment records, costs, warehouse, field maps and a carbon footprint calculator | FarmPortal supports cost and treatment records, fertiliser and crop protection databases, carbon farming and reports |
| 9 | Soil and water monitoring | A network of sensors and satellite models for monitoring nutrient runoff risk into water bodies | Linking farming practices, rainfall, soil, slope and water quality | A semantic data model combining agricultural treatments, environmental pressure and in situ monitoring | FarmCloud as a platform integrating data from fields, sensors, agricultural practices and external sources |
| 10 | Integrated Big Data and AI platforms | Farm digital twin for simulating yield, costs, weather risk and crop profitability | Building a model that combines crop biology, economics, weather, costs and agronomic decisions | Scenario simulations: what happens to yield, cost and margin when fertilisation, irrigation or treatment timing changes | FarmPortal as a source of operational data; FarmCloud as the analytical and integration environment |
| 11 | Data systems and interoperability | Open data exchange model between FMS, machinery, sensors, advisors and processors | Different data formats, closed manufacturer systems and lack of shared semantics | An interoperability layer for field, machinery, treatment, weather, sensor and production-batch data | FarmCloud as the integration platform; FarmPortal as a practical farm operating system |
| 12 | Traceability and the value chain | Digital product passport from field to buyer for fruit and vegetables | Combining field, harvest, warehouse, transport, quality control and buyer data | An auditable production-batch history with information on treatments, quality, costs, emissions and delivery history | FoodPass as the product-passporting and traceability layer; FarmPortal as the source of farm data |
Table 3. Top 12 example Agrostrateg T3 projects with research challenges, innovation and possible use of FarmPortal, FarmCloud and FoodPass.
How FarmPortal, FarmCloud and FoodPass support T3 projects
A T3 project needs not only a research model, but also an environment in which data can be collected, structured, analysed and made available to users. This is where FarmPortal, FarmCloud and FoodPass are useful. Each system is responsible for a different part of the data chain.
FarmPortal can serve as the operational farm management system. FarmCloud can act as a platform integrating data from farms, sensors, machinery, external systems and partners. FoodPass can support traceability, product passporting, quality audits and value-chain data.
FarmPortal features relevant to Agrostrateg T3
In the context of T3 projects, the most important features are those that create a repeatable data workflow. It is not only about recording a treatment, but about connecting the field, cost, weather, machinery, worker, warehouse, advisor and report.
- Precision fertilisation: analysis of soil tests and satellite imagery, fertilisation maps, fertiliser database and support for variable-rate application.
- Crop safety: crop condition monitoring, crop assistant, disease models and frost alerts.
- Machinery monitoring: integration with GPS, automatic steering, work reports, treatment history and fuel reports.
- Devices and sensors: weather stations, storage sensors, soil irrigation monitoring and IoT devices.
- Reports and analytics: crop rotation planning, crop production costs, plantation performance and machinery work analysis.
- Harvest and worker settlement: worker identifiers, harvest recording, quality parameters and crate scanning.
- Agricultural advisory: sharing field observations, remote advisory, access to costs and documents.
- Carbon and sustainable farming: resource-use planning, carbon footprint calculator and environmental impact monitoring.
More features are described on the FarmPortal farm management system features page. It is also worth checking the practical explanation of precision agriculture in FarmPortal and the guide Farm Management System – what it is and whether it pays off.
Agri Solutions’ experience in R&D projects
Agri Solutions develops solutions for digital agriculture and food supply chains. In the Agrostrateg context, experience related to FoodPass, food passporting, data integration, expert systems, IoT, AI/ML, data modelling and traceability is particularly relevant.
A second type of experience involves projects combining agronomic models, satellite data, AI, computer vision, IoT, yield estimation and optimisation of fertilisation and irrigation. These competences are directly linked to the scope of T3 because they enable a transition from data to decisions, and then to validation of effects in the field.
FarmPortal vs Excel, a simple app and a closed machinery system
Many farms start digitalisation with Excel, phone notes or an app supplied together with a machine. This is a good first step, but in research and development projects it is usually not enough. A T3 project needs a repeatable data model, history, integration, validation and reporting.
The comparison below shows the difference between simple digitalisation and a platform approach to digital agriculture. FarmPortal and FarmCloud are particularly useful when the project requires cooperation between many partners and data sources.
| Criterion | Excel / notebook | Simple point solution | Closed machinery manufacturer system | FarmPortal + FarmCloud |
|---|---|---|---|---|
| Field data | Manual entry, no map | Partial records | Machine-dependent | Fields, plots, history, maps, treatments and costs in one environment |
| Machinery data | No automation | Limited | Good, but often closed | GPS integration, work history, fuel reports and execution data |
| Sensor data | Separate files or panels | Vendor-dependent | Usually outside scope | Weather stations, irrigation monitoring, storage sensors and IoT |
| Cooperation with advisor | Phone, SMS, photos | Partial | Usually absent | Sharing data, observations, documents and field history |
| Traceability | Difficult and time-consuming | Partial | Usually lacks the full chain | Possibility of integration with FoodPass and a digital product passport |
| Usefulness in a T3 project | Low | Medium | Medium or high in the machinery component | High, especially in multi-source and consortium-based projects |
Table 4. Comparison of approaches to farm digitalisation in the context of Agrostrateg T3 projects.
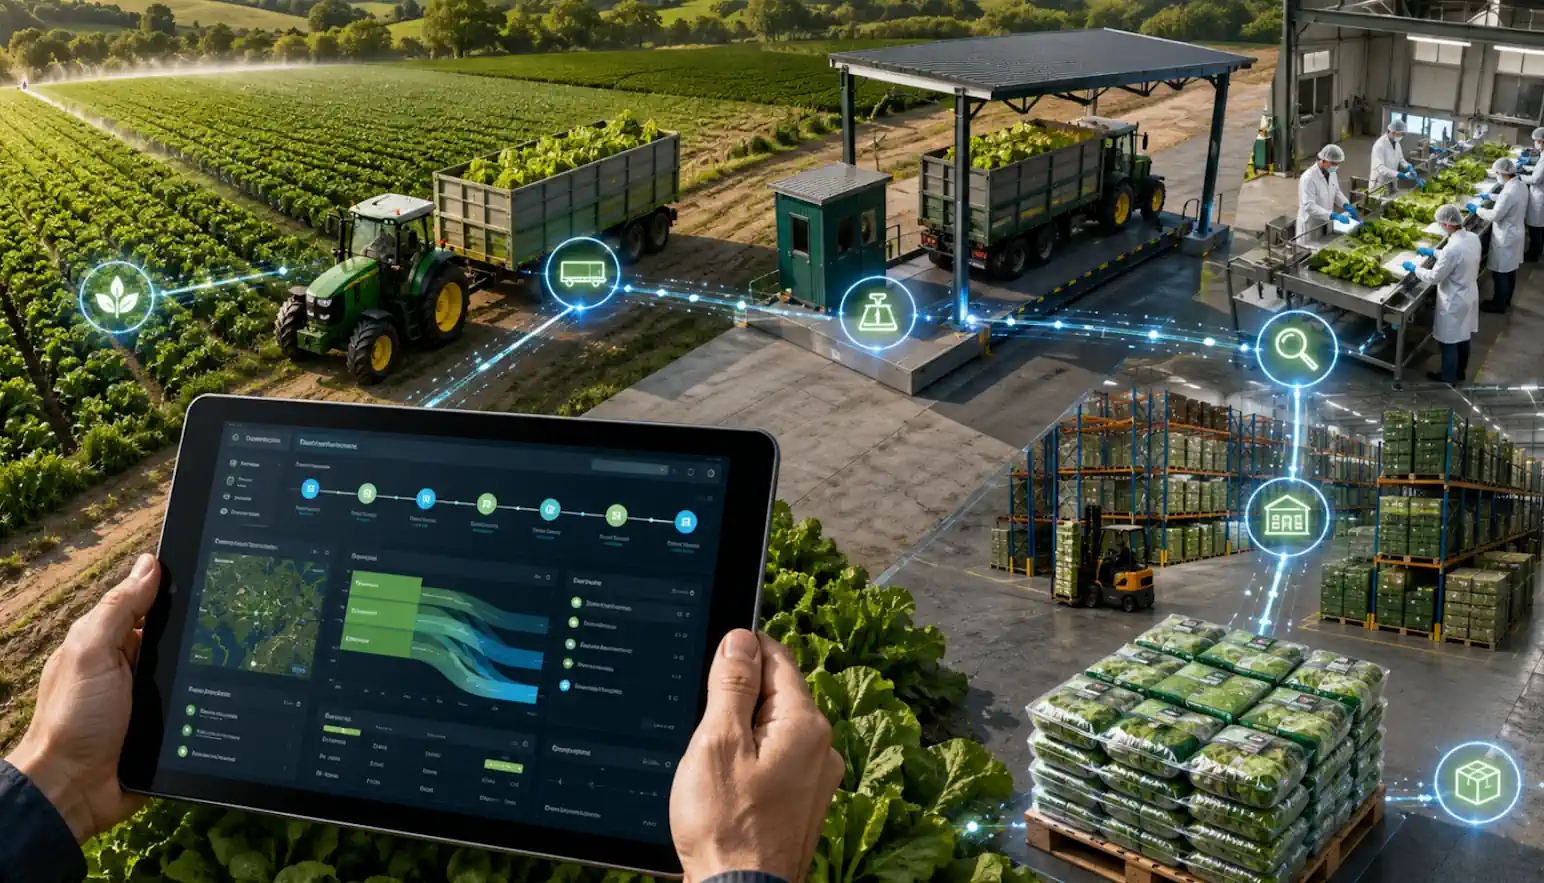
Case study: digital management of fruit and vegetable production
Context
The consortium includes a technology company, a research unit, a group of farms, agronomic advisors and a vegetable processor. The pilot covers a total of 620 hectares: onion, carrot, strawberry, raspberry and blueberry. The main problems are scattered data, difficulty forecasting raw material, high fertilisation and irrigation costs, and time-consuming documentation for the buyer.
Solution
FarmPortal serves as the operational farm layer: fields, plots, treatments, costs, workers, machinery, harvests and reports. FarmCloud integrates data from sensors, weather, satellite imagery and processor systems. FoodPass supports batch passporting, quality control and traceability from field to raw material reception.
Assumed pilot KPIs
| Area | Initial situation | Target after prototype implementation | How to measure it |
|---|---|---|---|
| Treatment documentation | Multiple Excel files, paper notes and photos on phones | 35% reduction in reporting preparation time | Measurement of report preparation time before and after implementation |
| Fertilisation | Fixed rates on large fields, limited zone-based work | 12% reduction in fertiliser use without loss of marketable yield | Comparison of rates, yield and quality in control zones |
| Irrigation | Decisions based on experience and general weather forecasts | 18% reduction in water use while maintaining quality parameters | Moisture sensors, irrigation-system data, crop quality |
| Raw material forecast | Forecasts updated manually and irregularly | Raw material availability forecast with error ≤ 15% four to six weeks before harvest | Comparison of forecast with actual raw material reception |
| Traceability | Reconstructing batch history takes 2 to 6 hours | Batch history reconstructed in less than 10 minutes | Batch audit test: field, treatments, harvest, warehouse, transport |
Table 5. Model KPIs for a digital fruit and vegetable production management pilot in an Agrostrateg T3 project.
Conclusion from the case study
The greatest value does not come from a single algorithm, but from combining operational, agronomic and quality data. If the farm, advisor and processor work on a shared data model, it becomes easier to control production costs, yield risk, raw material quality and buyer requirements.
How to prepare a T3 project step by step
A strong Agrostrateg T3 project should be prepared as a path from problem to implementation. The most common mistake is starting with technology: “we will build AI”, “we will create an application”, “we will connect sensors”. A better approach starts with the question: what production or environmental problem will be solved?
-
Define the problem.
Describe the problem in the language of the farmer, advisor or processor: excessive fertiliser use, lack of yield forecast, documentation errors, lack of machinery data, difficulty ensuring batch traceability.
-
Describe the research gap.
Explain why current solutions are not sufficient. The gap may concern model accuracy, lack of data, lack of interoperability, lack of validation in Polish conditions or lack of linkage between agronomic and economic data.
-
Select partners.
Build the consortium so that each partner has a real role. Avoid partners added only “for formal reasons”. In T3, access to data, fields, machinery, sensors, laboratories and end users matters.
-
Design the data model.
Determine what data will be collected, in what units, at what frequency and who will own it. This is critical for AI, IoT, remote sensing, VRA and traceability.
-
Plan the prototype.
Define what will work at the end of the project: panel, application, API, machinery integration, AI model, recommendation algorithm, digital product passport or alert system.
-
Define KPIs.
Compare the initial and target situations. Select production, economic, environmental and organisational indicators.
-
Plan the pilot.
Select farms, fields, animals, machinery, crops or production batches. The pilot should confirm system performance in real conditions, not only in the laboratory.
-
Describe implementation and commercialisation.
Show who will use the solution after the project, under what business model and how it will be technically maintained.
Agrostrateg T3 project checklist
This checklist helps quickly assess whether the project concept is ready for further development. It can be used during a consortium workshop, a discussion with a university or the preparation of a project concept note.
Consortium quick guide
- Does the project concern one of the T3 topics: FMS, IoT, remote sensing, AI, robotics, VRA, welfare, interoperability or traceability?
- Has a real production, economic or environmental problem been described?
- Is it clear what data will be collected and who will provide it?
- Does the project have a technology partner capable of building the prototype?
- Does the project have a research partner capable of describing the methodology and validation?
- Does the project include farms, animals, fields, machinery or a pilot plant?
- Have KPIs before and after implementation been defined?
- Have risks been described: data quality, lack of integration, poor internet, seasonality, sensor failures?
- Can the project result be implemented after the funding period ends?
- Does the system avoid creating another data island and instead support interoperability?
Expert and user quotes
“The biggest change is not the application itself, but the fact that I can see the field, treatment, cost, weather and advisor’s decision in one place. With 480 hectares of vegetables and cereals, reducing manual reporting by even one third means real time savings during the season.”
“In processing, the problem is not a lack of raw material in general, but a lack of predictability: when it will be available, in what quality and with what treatment history. Digital cooperation with farms improves contracting and speeds up batch audits.”
“A T3 project should be built around data and validation. If an algorithm recommends a rate, it must be clear what data it uses, what accuracy it achieves and how the farmer can verify the recommendation in practice.”
Data methodology and assumptions
The article distinguishes three types of information. First, programme facts relating to AGROSTRATEG, including the scope of T3 and the logic of R&D projects. Second, product information relating to FarmPortal, FarmCloud and FoodPass. Third, example project KPIs, which are model assumptions and should be verified in a specific pilot.
The numerical data in the case study are proposed indicators for a pilot project, not a declaration of results achieved by a specific client. In a real proposal, they should be supplemented with baseline data from farms, pre-implementation measurements and a statistical validation plan.
What sources the context is based on
The context of digital agriculture is based on AGROSTRATEG programme documentation, FarmPortal materials and publications on agricultural digitalisation, AI and farm structure in the European Union. Research on the adoption of precision technologies shows that farmers expect economic and environmental benefits, but barriers such as cost, complexity and lack of competences still limit implementation.
Conclusion
Digital agriculture in Agrostrateg T3 is an opportunity for projects that combine science, practice and technology. The strongest concepts will not focus on digitalisation alone, but on concrete results: better fertilisation efficiency, lower water use, more accurate yield forecasting, faster disease detection, improved animal welfare, data interoperability and full traceability across the value chain.
FarmPortal, FarmCloud and FoodPass can support such projects as operational, integration and audit layers. As a result, the consortium does not have to start from a blank page. It can base the project on existing modules, data and implementation experience, while focusing the research and development part on a new method, algorithm, data model or prototype.
The most important recommendation is simple: start with the problem, build the consortium around data, plan validation and show how the project result will be implemented after the funding period ends.
Glossary
The glossary below explains the most important terms used in digital agriculture projects. The definitions are practical and refer to how farms, advisors, machinery manufacturers or processors work.
- Digital agriculture
- The use of data, software, sensors, machinery, remote sensing and analytics to manage crop or livestock production.
- FMS, or Farm Management System
- A farm management system. It helps manage fields, treatments, costs, machinery, workers, warehouse, reports and documentation.
- IoT in agriculture
- A network of measurement devices, such as weather stations, soil moisture sensors, storage sensors, water meters or animal sensors.
- Remote sensing
- Obtaining information about crops from satellites, drones or cameras without direct contact with the plant.
- NDVI
- A vegetation index used to assess crop condition based on optical data. It helps detect differences in crop development.
- VRA, or variable rate application
- Automatic adjustment of the fertiliser, spray, seed or water rate depending on the field zone and prescription map.
- Farm digital twin
- A digital model of a farm or crop that enables analysis of production scenarios, costs, risk and the impact of decisions on outcomes.
- Interoperability
- The ability of different systems, machines and applications to exchange data in an understandable and structured way.
- Traceability
- The ability to identify a product or batch from field, through harvest and storage, to the processor, distributor or final buyer.
- Product passport
- A digital set of product information covering origin, treatment history, quality, logistics, certificates and environmental data.
FAQ
Can a farmer be a partner in an Agrostrateg T3 project on digital agriculture?
Yes. A farmer may act as an end user, pilot farm, technology validator or business partner. Their participation is particularly valuable when the project requires real data, field tests, usability assessment and confirmation of implementation effects.
Does an Agrostrateg T3 project have to include artificial intelligence?
Not always. AI is highly useful in yield forecasting, image analysis, treatment recommendations, disease detection, animal monitoring and supply-chain optimisation. However, the key is not the use of AI itself, but proving the research gap, validating the model and delivering real value to the user.
Can an agricultural machinery manufacturer submit a project on ISOBUS integration, telemetry and FMS?
Yes. Such a project may fit T3 if it concerns data interoperability, work automation, variable rate application, machinery monitoring, treatment execution reporting or machine-to-cloud communication. It is best to combine the machinery manufacturer with pilot farms, an IT company and a research unit.
Can a fruit and vegetable processor benefit from a T3 project?
Yes. A processor can develop digital contracting, raw material availability forecasting, quality control, traceability, batch passporting and emissions reporting. The greatest value is created when farm data is combined with data on reception, warehouse, transport and quality.
Can FarmPortal be the implementation layer of an Agrostrateg T3 project?
Yes. FarmPortal can function as a farm management system, treatment-recording layer, field database, cost panel, reporting tool, advisor cooperation system and integration point for data from machinery, sensors and weather. In larger projects, FarmCloud can serve as the integration platform for multiple data sources.
How can a research and development project be distinguished from a standard app implementation?
A research and development project contains technological or research uncertainty. It develops a new method, algorithm, data model, integration or validation approach. A standard implementation mainly involves configuring an existing tool and does not solve a new research gap.
What data is most important in digital agriculture projects?
The most important data is data that connects a decision with its effect. In crop production, this includes fields, soil, weather, treatments, fertilisation, crop protection products, yield, quality, costs and machinery data. In livestock production, it includes animal identification, activity, feeding, health, welfare, treatment and environmental parameters.
Sources
The article uses AGROSTRATEG programme documentation, FarmPortal materials and selected scientific and statistical publications on digital agriculture, AI and farm structure in the European Union.
- National Centre for Research and Development, AGROSTRATEG programme documentation, first call, 2026.
- OECD, AI in agriculture: Progress in Implementing the European Union Coordinated Plan on Artificial Intelligence, 2026.
- Eurostat, Farms and farmland in the European Union – statistics, 2023.
Follow us!
See what we're doing and be inspired by positive changes.