Soil sampling determines whether a laboratory result reflects the actual conditions in the field. You can run highly accurate tests for pH, phosphorus, potassium and magnesium and still end up with a result of limited practical value if the material was taken from random locations or clearly different parts of the field were combined into one sample.
Summary: For standard testing of arable soils, a composite sample may represent up to 4 ha if the area is uniform in terms of soil conditions and topography. It should be made up of at least 20 subsamples taken from the 0–20 cm layer and, once mixed, should weigh approximately 0.5 kg.
In brief
Start by defining a uniform area, then look at the hectares. Guidance from Polish chemical and agricultural stations allows one composite sample to represent up to 4 ha on a uniform site. If a field contains clear differences in soil, topography or fertilisation history, those areas are better treated as separate sampling zones.
- area represented by one composite sample: up to 4 ha on a uniform site;
- number of subsamples: at least 20;
- sampling depth for standard arable soil testing: 0–20 cm;
- weight of the composite sample after mixing: approximately 0.5 kg;
- Nmin requires a separate sampling method.

What soil sampling rules apply in practice?
Guidance issued by Polish chemical and agricultural stations bases standard sampling for pH and nutrient testing on the PN-R-04031:1997 methodology. For farmers, four parameters matter most: the area represented by the sample, the number of sampling points, the sampling depth and correct labelling of the material.
The current guidance from OSChR in Olsztyn states that a composite sample should represent an area with similar natural and agronomic conditions. Where the soil and topography are relatively uniform, the area must not exceed 4 ha. A composite sample should contain at least 20 subsamples taken from the 0–20 cm layer. After mixing, approximately 0.5 kg of soil is sent to the laboratory.
| Element | Value | How to apply it in practice |
|---|---|---|
| Area | up to 4 ha | for a uniform area with similar soil and agronomic conditions |
| Subsamples | at least 20 | distributed across the whole area represented by the sample |
| Depth | 0–20 cm | for standard sampling from the cultivated soil layer |
| Composite sample weight | approximately 0.5 kg | after the subsamples have been mixed thoroughly |
| Timing | spring or autumn | before fertiliser application |
Sources: Okręgowa Stacja Chemiczno-Rolnicza w Olsztynie, “Instrukcja pobierania próbek glebowych”, checked on 17 August 2026; J. Korzeniowska, E. Stanisławska-Glubiak, T. Jadczyszyn, W. Lipiński, “Nawożenie upraw rolniczych mikroelementami. Nowe liczby graniczne do oceny zawartości mikroelementów w glebie”, Instrukcja Upowszechnieniowa nr 249, IUNG-PIB, 2021. The section “Sposób pobierania próbek gleby” specifies an area of up to 4 ha, 20–25 subsamples, the 0–20 cm layer and PN-R-04031:1997 as the basis for standard sampling. IUNG-PIB and KSChR material on micronutrients.
How many soil samples should you take from a field?
The number of composite samples depends on the size and variability of the field. On a uniform 12 ha field, three composite samples may be planned. If part of the field has a different soil type, a distinct slope or a long history of different fertiliser management, that area should be given its own sample number.
This is where mistakes often begin. To reduce the number of laboratory analyses, a farmer may divide the field geometrically into equal blocks. A sampling boundary then ends up running through the middle of a depression, across the transition between sandy and heavier soil, or through an area that was limed separately several years earlier. The laboratory will report a single average for material that combined two different situations from the outset.
| Field situation | Sampling approach | What averaging may conceal |
|---|---|---|
| Uniform soil and similar fertilisation history | up to 4 ha per composite sample | the result may represent the entire area well |
| Clear soil variability | divide the field into separate sampling areas | an average may hide differences in nutrient status and pH |
| Part of the field fertilised or limed differently | take a separate sample from that area | a whole-field average becomes less useful when planning application rates |
| A local problem requiring diagnosis | take a separate diagnostic sample | the unusual area does not distort the composite sample |
How to take soil samples step by step
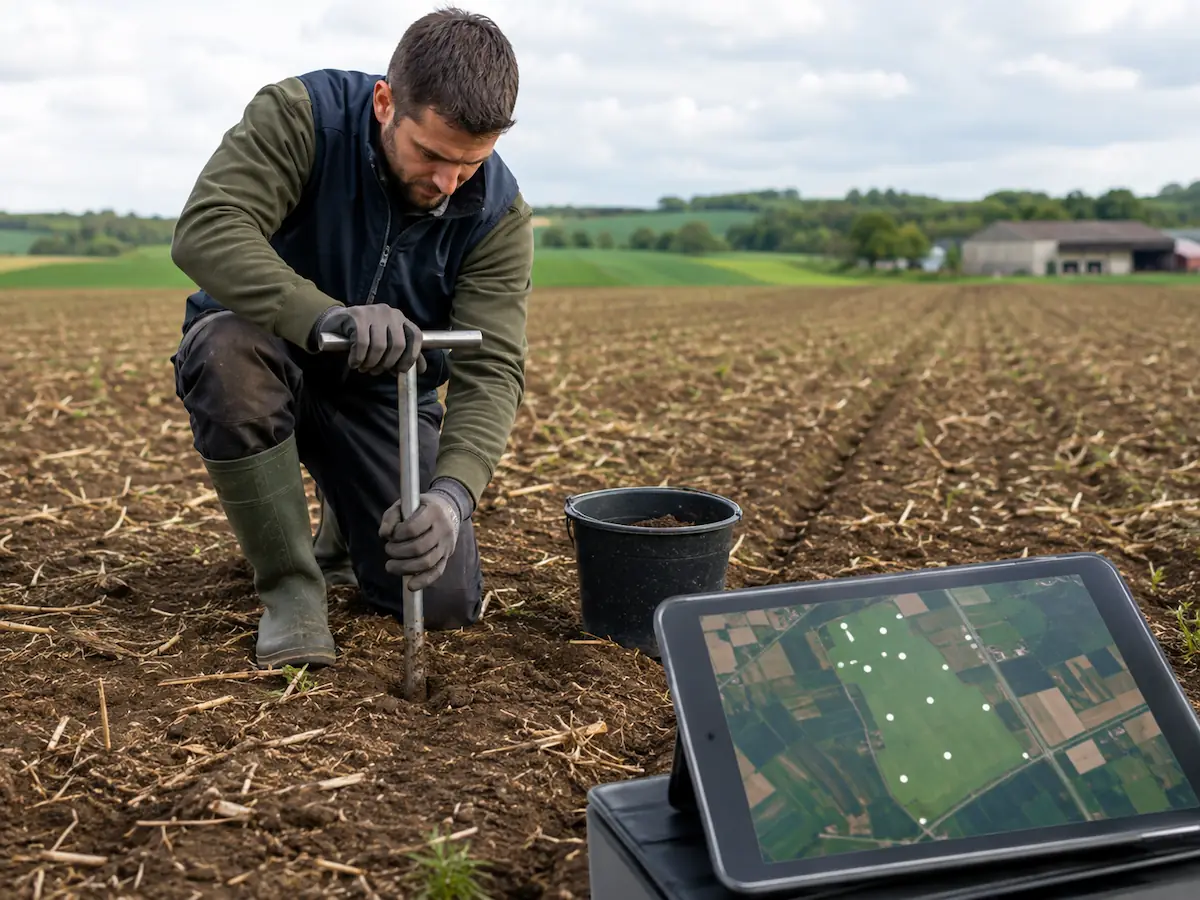
The easiest way to start is with a field sketch or map. Assign sample numbers before going out to the field so that you do not later have to reconstruct from memory which area each bag came from.
- Define areas with similar soil, topography, cropping and fertilisation history.
- Give each planned sample a number and mark its area on a sketch or map.
- Move across the field so that sampling points are spread over the whole area represented by the sample; OSChR recommends moving perpendicular to the direction of field operations.
- Take at least 20 subsamples from the same depth. For standard arable soil analysis, this is 0–20 cm.
- Place the material in a clean container and mix it thoroughly.
- Prepare approximately 0.5 kg of the composite sample.
- Label the container with the same number shown on the map or sketch.
The final step sounds trivial until a dozen samples from neighbouring fields are sitting on the table. A number such as “7” tells you very little on its own. The sample number, field, sampling area and date should form a single record that can still be traced several seasons later.
Which areas should you avoid when sampling?
OSChR recommends avoiding field margins within a strip of up to 5 m, former haystack and heap sites, ditches, furrows, molehills, gravel patches, depressions and steep rises. Soil properties in these locations may differ from those in the main part of the field. If they are agronomically significant, it is better to test them separately.
Samples should not be taken immediately after mineral or organic fertiliser application. The guidance also identifies periods of severe drought and very wet soil as unsuitable for sampling. When scheduling the work, allow enough time for laboratory analysis, particularly if the result is intended to influence fertilisation before the next season.
Why is 4 ha an upper limit rather than a target?
In practice, 4 ha is the upper limit for a uniform sampling area. There is no reason to extend a sample to cover that full area if the soil or management history changes clearly within a smaller section of the field.
Plants on a rise may show water stress earlier. Just a few dozen metres away, a heavier patch of soil may hold moisture for longer and have produced a different yield pattern for years. If soil from both places goes into the same bucket, the laboratory result will not show that difference.
When management zones are being planned, soil test results can later be compared with field history and other data. We describe this approach in more detail in our article on management zones in the field.
How does Nmin sampling differ?
Mineral nitrogen testing requires a separate sampling procedure. For fertilisation purposes, Krajowa Stacja Chemiczno-Rolnicza recommends sampling in early spring before fertiliser is applied, with separate samples taken from the 0–30 cm and 30–60 cm layers. To assess residual nitrogen after the growing season, samples are taken in autumn after harvest from the 0–90 cm profile.
A sample prepared for pH, P, K and Mg testing from the 0–20 cm layer therefore cannot replace an Nmin sample.
Source: Krajowa Stacja Chemiczno-Rolnicza, “Instrukcja pobierania próbek glebowych do oznaczania zawartości azotu mineralnego”, prepared on the basis of PN-R-04028:1997 and the IUNG methodology developed in Puławy. KSChR guidance on Nmin.
What can you do with soil analysis results in FarmPortal?
In FarmPortal, sampling zones and sampling points can be defined using a grid or a custom boundary, while laboratory documents and digital analysis results can be stored in the system. It supports standard soil analysis, micronutrients, mineral nitrogen, humus and sulphur, among other parameters. These data can then be used in fertiliser calculations.
Internal FarmPortal data show that only around 2–3% of users use saved soil analysis results directly in fertiliser calculations. This points to a practical problem that goes beyond carrying out the test itself: the result reaches the farm, is saved in a file or put in a folder, and that is where its use often ends.
The most useful workflow is straightforward: plan the sampling points, keep the sample number and location, enter the result and then use it in a calculation for the relevant field. FarmPortal features covering soil testing, fertiliser calculations and variable-rate maps are described on the precision fertilisation in FarmPortal page.
What does a farm gain from a well-planned sampling process?
First, the farmer knows exactly what the result relates to. Nutrient status can be compared between parts of the field, previous tests can be revisited, and persistent differences can be tracked over several years. An adviser receives a result tied to a specific area instead of a table with no clear spatial reference.
This becomes even more important in precision fertilisation. A nutrient map built from poorly labelled or arbitrarily averaged samples may look professional, but its underlying data will be weak. The field should therefore be divided carefully and sampled properly before the data are entered into any software.
Example: how should a 20 ha field be divided?
Illustrative example.
The field covers 20 ha. A simple division based solely on the area limit would produce five composite samples of approximately 4 ha each. The map and management history, however, show that the northern section has lighter soil, the central area was limed separately, and the southern depression regularly retains more water.
Instead of five equal rectangles, eight sampling areas were defined to reflect these differences. Each was given its own number and sample. Once pH, P, K and Mg have been analysed, the results can be assigned to the same parts of the field to check whether they genuinely require different fertilisation strategies. If the differences turn out to be small, the zoning can be simplified in the next sampling campaign.
FAQ – soil sampling
How many soil samples should be taken per hectare?
There is no single “x samples per hectare” rule. For a reasonably uniform 10 ha field, three composite samples may be a sensible starting point, while marked soil variability or a different liming history may justify a denser division. It is better to define sampling areas before entering the field.
How many subsamples should make up one composite sample?
The current guidance from OSChR in Olsztyn requires at least 20 subsamples. Krajowa Stacja Chemiczno-Rolnicza gives a range of 20–25 subsamples in its material on micronutrients for standard sampling from the 0–20 cm layer.
What is the correct soil sampling depth?
The depth depends on what the laboratory is testing. For standard pH, P, K and Mg analysis on arable land, soil is taken from the 0–20 cm layer. For Nmin, material from 0–30 cm and 30–60 cm is submitted as separate samples, so the scope of testing should be agreed before sampling starts.
When is the best time to take soil samples?
OSChR recommends spring or autumn before fertiliser application. Sampling should be avoided immediately after mineral or organic fertilisation, as well as during severe drought or when the soil is very wet.
Can one sample represent exactly 4 ha?
It may represent up to 4 ha if the entire area has similar soil conditions, topography and agronomic history. Where clear differences occur, separate sampling areas are preferable even if each one is considerably smaller.
Is Nmin sampled in the same way as soil for pH, P, K and Mg?
No. For fertilisation purposes, Nmin is sampled in early spring before fertiliser application, separately from the 0–30 cm and 30–60 cm layers. KSChR guidance specifies 10 subsamples, or 15 where organic fertiliser has been applied. Material from the two depths is not combined into a single sample.
How can soil analysis results be used in FarmPortal?
Results can be stored digitally and assigned to a field or a defined sampling area. FarmPortal can use soil test data in fertiliser calculations and, in subsequent work, in preparing fertilisation maps and management zones.
Glossary
- Subsample
- An individual portion of soil taken from one point in the field.
- Composite sample
- Material created by combining and mixing subsamples collected from one sampling area.
- Sampling area
- A part of the field with similar soil and agronomic conditions, represented by one composite sample.
- Soil pH
- A measure of soil acidity or alkalinity used, among other things, when assessing liming requirements.
- Nmin
- Mineral nitrogen in the soil, measured using a separate sampling procedure.
- VRA
- Variable Rate Application, meaning the application of inputs at varying rates according to an application map.
Summary
Before sampling, do not start with a calculator asking how many samples you need for a given number of hectares. First draw the boundaries of areas that are genuinely similar. Only then apply the limit of up to 4 ha and prepare each composite sample from at least 20 sampling points.
If you are planning soil tests ahead of the next season, prepare the map and sample numbering before going into the field. Once the results come back, use the same areas again when calculating fertiliser requirements.
Follow us!
See what we're doing and be inspired by positive changes.