Variable-rate spraying allows growers to tailor crop protection to the differences within a field, rather than applying the same treatment everywhere. We explain how prescription-map zones are defined, how the instructions reach the sprayer and how to calculate potential savings realistically before starting work.
Variable-rate spraying is a precision farming technique in which a sprayer follows spatially variable application instructions based on crop data and validated by agronomic assessment. A map does not make the crop protection decision. It is a means of carrying out a decision that has already been made and justified.
At a glance
Variable-rate spraying maps divide a field into zones with specified treatment parameters. FarmPortal uses NDVI, NDRE and crop information to help define these zones. The system generates between one and five zones, with map processing taking 3–200 seconds. Vegetation indices alone, however, cannot determine a pesticide application rate. The decision must be checked against field observations, pest and disease risk, and the product label.
- Variable-rate spraying maps can be generated free of charge for up to 100 ha.
- The largest individual fields processed were 172 ha in Poland and 418 ha in Australia.
- A 5–15% reduction in product use is an illustrative planning range, not a guaranteed outcome.
- All variable application rates must comply with the product label.
How does variable-rate spraying differ from a conventional treatment?
In a uniform-rate treatment, the sprayer applies the same rate across the entire field. With VRA (Variable Rate Application), the terminal reads a prescription map and adjusts treatment parameters in the designated zones according to the machine's GNSS position. This requires a suitable controller and an approved agronomic recommendation.

The product application rate in l/ha must not be confused with the spray mixture volume in l/ha. Automatic section control reduces overlap, but it is not the same as varying the pesticide application rate.
| Method | Basis for the decision | How the machine operates | Main limitation |
|---|---|---|---|
| Uniform-rate spraying | One recommendation for the whole field | Constant rate across the entire area | Does not account for variation within the field |
| Zone-based VRA spraying | NDVI/NDRE maps, field scouting and historical data | Adjusts application to designated zones | Requires sound recommendations and a compatible terminal |
| Camera-guided spot spraying | Real-time object recognition | Activates individual nozzles or targeted spray points | Requires specialist equipment and reliable detection |
A map may look convincing even when a thin crop is the result of drought rather than disease. Automatically converting map colours into application rates is a common mistake.
How are variable-rate spraying zones defined?
A zone should reflect a genuine agronomic difference, not merely a change in pixel colour. In practice, several sources of information are combined:
- Satellite and drone imagery: biomass, crop condition and variation captured by NDVI and NDRE.
- Weed maps: the distribution of weeds established through image recognition or field scouting.
- Disease models: temperature, humidity, leaf wetness, rainfall and BBCH growth stage.
- Field history: yields, previous treatments, disease incidence, soils and water stress.
- Sensors and cameras: real-time plant detection, particularly for spot spraying.
It is essential to distinguish persistent problems from one-off events. A patch affected by frost does not automatically justify a lower fungicide rate. Weather data and decision-support systems (DSS) are covered in FarmPortal's crop health and safety module.
What do NDVI and NDRE actually show on a prescription map?
NDVI (Normalised Difference Vegetation Index) indicates vegetation activity using the reflectance of red and near-infrared light. NDRE (Normalised Difference Red Edge Index) uses the red-edge band and can be more useful in established, dense crops, where NDVI becomes less sensitive.
Neither index can identify a pathogen, a weed or the correct pesticide application rate on its own. A high reading may simply mean more biomass, while the spectral signal from weeds can be mixed with that of the crop. The assumption that “higher NDVI means more spraying” is therefore wrong. The map highlights where to investigate; the treatment objective, field scouting and actual conditions determine the decision.
How to prepare a variable-rate spraying map in FarmPortal, step by step
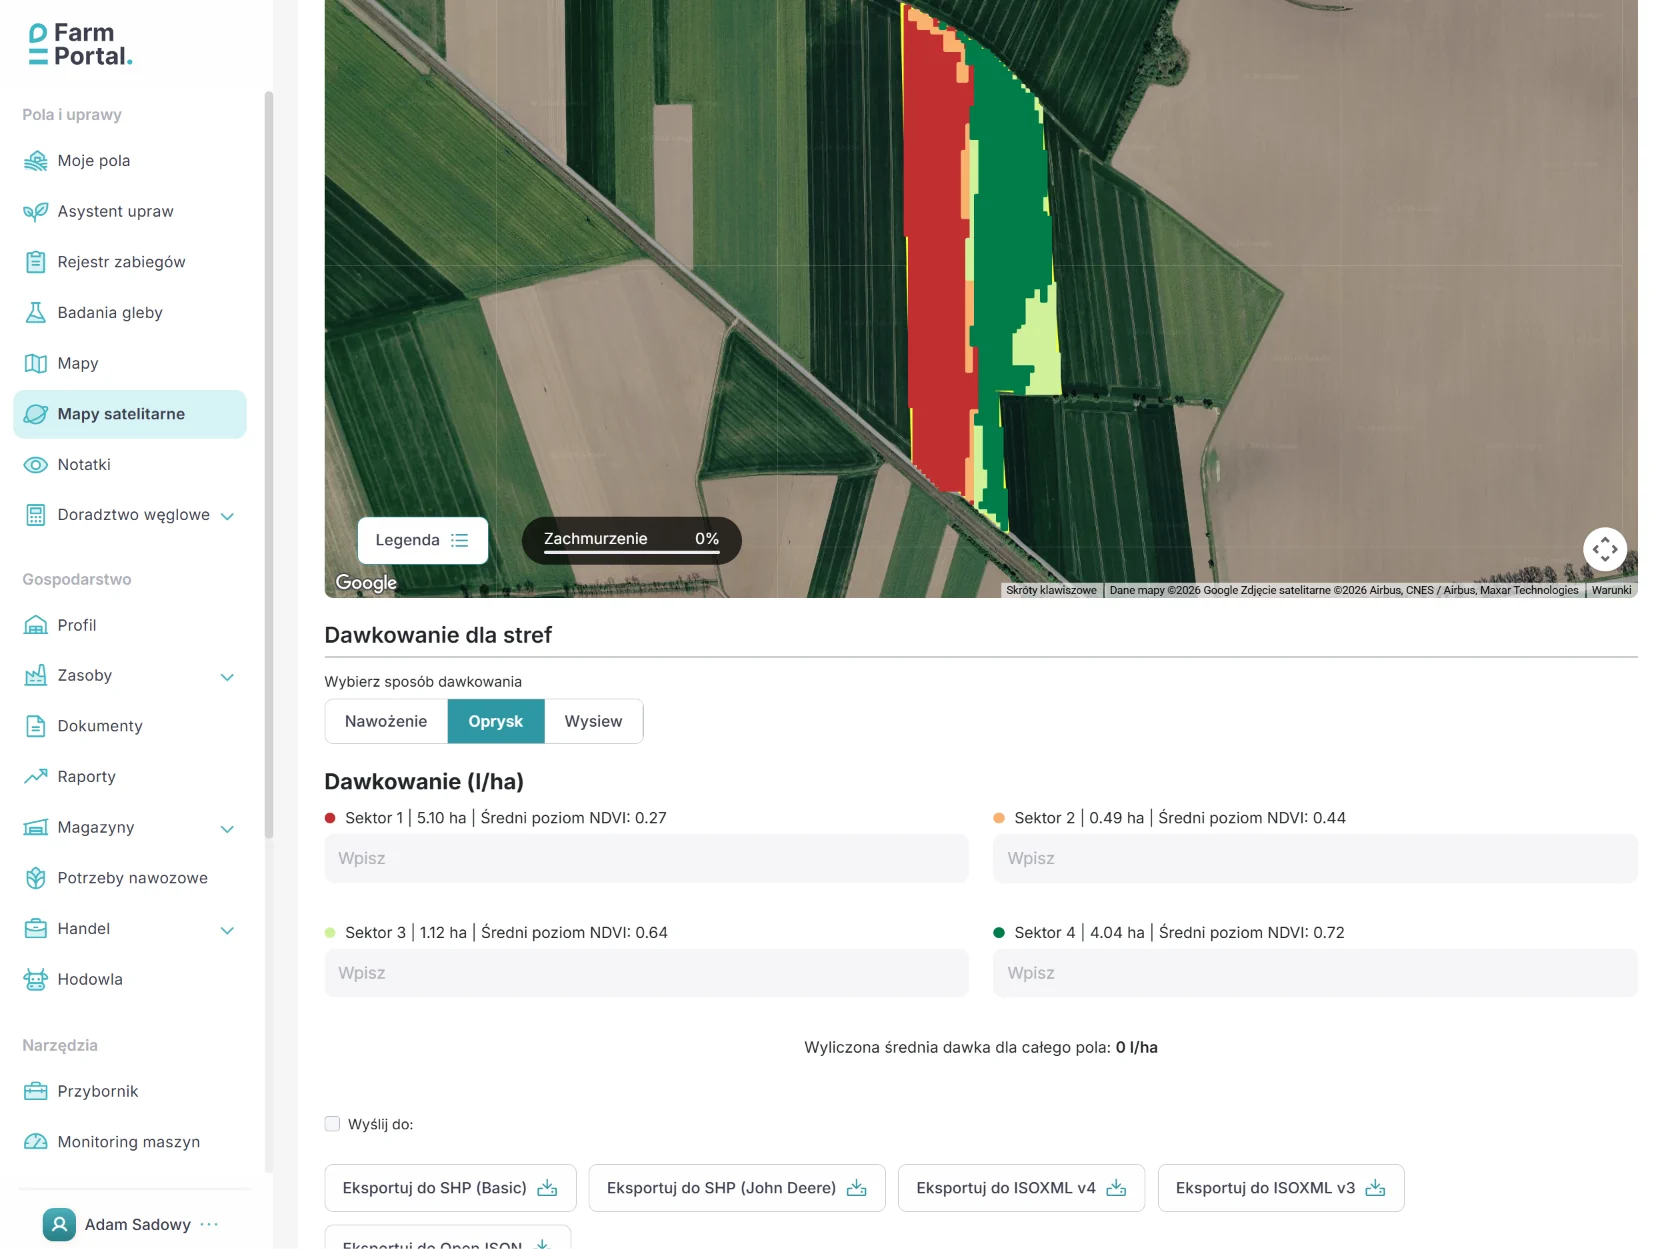
FarmPortal generates variable-rate spraying maps using NDVI and NDRE indices, dividing a field into one to five zones. Recommendations must be reviewed before the task is exported to the machine.
- Select the field, image date and BBCH growth stage; check whether the imagery is recent and free from problematic cloud cover.
- Compare NDVI and NDRE with field history and scouting results.
- Start with two or three zones, up to a maximum of five, and approve the permitted treatment parameters.
- Prepare an ISO-XML or SHP file where supported by the terminal, and check the units.
- After treatment, record actual product use and compare the planned operation with what was applied.
FarmPortal's own data: users generate hundreds of variable-rate spraying maps during the season. Map processing takes 3–200 seconds, depending on field size. The largest individual fields processed covered 172 ha in Poland and 418 ha in Australia. Among variable-rate map types used in FarmPortal, spraying ranks third, after fertiliser application and seeding.
Free for up to 100 ha: FarmPortal users can generate variable-rate spraying maps without a charge for this feature, subject to the current terms of service. Explore FarmPortal's features and the guide to preparing VRA tasks and machinery files.
How does AI support field analysis, and what should it not decide?
Artificial intelligence (AI) can help bring together cropping history, satellite imagery, weather and treatment records in FarmPortal, highlighting anomalies that warrant a field inspection. This helps farmers and agronomists identify which parts of a field to check first. An algorithm should not, however, diagnose a disease and approve a pesticide rate independently.
AI-enabled cameras can separately identify weeds in real time. That does not mean an NDVI/NDRE map generator automatically recognises weed species. With the appropriate integration, machinery data collected after treatment can be used to compare planned and actual applications. This is an area being developed through FarmPortal's collaboration with Rootsey.
How much can variable-rate spraying save on crop protection products?
For FarmPortal planning calculations, it is reasonable to consider scenarios involving a 5–15% reduction in product use where zone-based application is agronomically justified and permitted by the label. This is a range to test on an individual field, not the measured average saving across all FarmPortal users.
Field trials suggest greater potential for targeted spraying technologies, but their results should not be treated as equivalent to NDVI-based prescription maps. Gerhards and colleagues reported an average reduction of approximately 25% in herbicide use with camera-guided spraying in trials conducted in 2023–2024 and published in Weed Research (2026). In some locations, savings were below 5%. Gerhards et al., 2026 study.
In a drone remote-sensing trial described in Scientific Reports (2023), herbicide consumption was approximately 26% lower on average than with blanket spraying. 2023 study. Both figures relate to specific technologies and conditions; neither represents a guaranteed FarmPortal saving.
Actual financial returns must also account for equipment, labour, crop protection efficacy and any additional corrective treatments. A lower pesticide bill does not, by itself, establish a positive return on investment.
A 100 ha farm example: three application zones and the financial result
For a single treatment covering 100 ha, assume a product rate of 1.2 l/ha and a price of PLN 180/l. Uniform-rate spraying would use 120 l, costing PLN 21,600. Following field scouting, three zones are identified where rates ranging from 1.0 to 1.2 l/ha may be used, but only if permitted by the specific product label.
| Approach / zone | Area | Application rate | Product used | Product cost |
|---|---|---|---|---|
| Uniform rate | 100 ha | 1.2 l/ha | 120 l | PLN 21,600 |
| VRA – Zone A | 25 ha | 1.0 l/ha | 25 l | PLN 4,500 |
| VRA – Zone B | 50 ha | 1.1 l/ha | 55 l | PLN 9,900 |
| VRA – Zone C | 25 ha | 1.2 l/ha | 30 l | PLN 5,400 |
| Total VRA | 100 ha | Average 1.1 l/ha | 110 l | PLN 19,800 |
| Difference | 100 ha | 8.3% lower | 10 l less | PLN 1,800 less |
Illustrative example based on the way FarmPortal users define application zones, rather than data from an actual deployment. The rates shown are not recommendations for any particular product; each rate must be authorised on its label.
The product saving is 10 l, equivalent to PLN 1,800 (8.3%). At the same baseline treatment cost, reductions of 5%, 10% and 15% would save PLN 1,080, PLN 2,160 and PLN 3,240 respectively. Equipment and operating costs are excluded, and the saving should not be multiplied by the number of seasonal spray applications without further assessment.
When is variable-rate spraying not worthwhile, and what should you check before setting off?
We do not recommend varying rates without good reason. A uniform field, evenly distributed disease pressure, outdated imagery or a product label that does not permit the proposed range of application rates may all make conventional uniform-rate spraying the safer option. Five zones are not necessarily better than two.
Before leaving the yard, check file compatibility, units, terminal capabilities, GNSS positioning, valve response times, nozzles and calibration. ISOBUS (ISO 11783) and ISO-XML facilitate data exchange but do not guarantee that every sprayer supports variable-rate application.
A prescription map never overrides the product label, including permitted crops, application rates, timing, pre-harvest intervals and buffer zones. Treatment records and the reasons for carrying out the application must also be documented in line with integrated pest management requirements. Information current as at November 2026.
For farmers, the main considerations are cost and effective crop protection. Farm managers compare operations across fields, while agronomists can target field scouting more efficiently. The number of maps generated is not a measure of treatment quality.
Frequently asked questions about variable-rate spraying
What is variable-rate spraying?
Variable-rate spraying means applying crop protection products at different rates or treatment intensities in different field zones rather than uniformly across the whole area. The decision is based on a prescription map, field observations and agronomic assessment. The sprayer must be capable of carrying out the task, and both the product and every application rate must comply with its label.
Are NDVI and NDRE enough to determine a pesticide application rate?
No. NDVI primarily indicates differences in vegetation activity and biomass, while NDRE helps assess the condition of established crops. Neither index independently identifies weeds, pathogens or the correct product rate. The map must be checked against field scouting, BBCH growth stage, weather, field history and the product label.
How do I generate a variable-rate spraying map in FarmPortal?
Select a field and recent satellite data, compare the NDVI and NDRE indices, then define between one and five zones. Check them in the field, assign agronomically justified rates and approve the map. The task can be prepared for export, for example as ISO-XML or SHP, provided this meets the requirements of the particular terminal and sprayer.
How much could I save with variable-rate spraying?
For initial planning, FarmPortal uses illustrative scenarios involving a 5–15% reduction in product use, where varying the rate is justified. With a baseline product cost of PLN 21,600, this would represent savings of PLN 1,080–3,240. It is neither a guarantee nor a measured result across all fields. Crop protection efficacy and operating costs also need to be considered.
Are FarmPortal variable-rate spraying maps free?
Yes. FarmPortal allows users to generate variable-rate spraying maps free of charge for areas of up to 100 ha. Creating a map does not, however, mean that every sprayer can carry out variable-rate application. Check the file format, terminal capabilities, rate control, calibration and current terms of service before starting work.
Can every ISOBUS sprayer follow a prescription map?
No. Compliance with ISOBUS (ISO 11783) does not automatically mean that a sprayer supports prescription maps. Both the terminal and sprayer controller need the relevant functions, including spatial task management where applicable, and must interpret units and rate-control instructions correctly. Test the file in the cab before filling the tank and heading into the field.
Can AI decide independently where to spray and how much to apply?
AI can help identify unusual zones, compare data over time and highlight places that need scouting. It should not independently diagnose disease or determine a permitted pesticide rate. In FarmPortal, data analysis supports decision-making, while the agronomist or farmer approves the treatment based on field conditions and the product label.
Glossary of key terms
- VRA (Variable Rate Application)
- Applying an agricultural input at different rates, or varying a treatment parameter, across zones within the same field.
- Prescription map
- A spatial instruction file for agricultural machinery, specifying zones and their corresponding application parameters.
- NDVI
- An index derived from red and near-infrared light that indicates vegetation activity, not a diagnosis of disease.
- NDRE
- An index using the red-edge band, useful for assessing differences in the condition of more developed crops.
- BBCH
- A scale describing plant growth stages, used to assess treatment timing and interpret risk.
- ISOBUS / ISO 11783
- A communication standard for agricultural machinery, terminals and controllers; it does not automatically confer VRA support.
- ISO-XML
- A format for exchanging agricultural task data, including prescription maps, between compatible systems.
- As-applied map
- A record of the treatment actually delivered, used to compare planned rates with sprayer operation.
From map to decision: where should you start?
Choose one field with clear variation, compare NDVI with NDRE, inspect the problem areas and prepare two or three zones. Check the proposed rates against the product label and confirm terminal compatibility. After spraying, compare planned and actual product use as well as crop protection efficacy. That is a more meaningful test than simply counting the colours on a map.
Follow us!
See what we're doing and be inspired by positive changes.